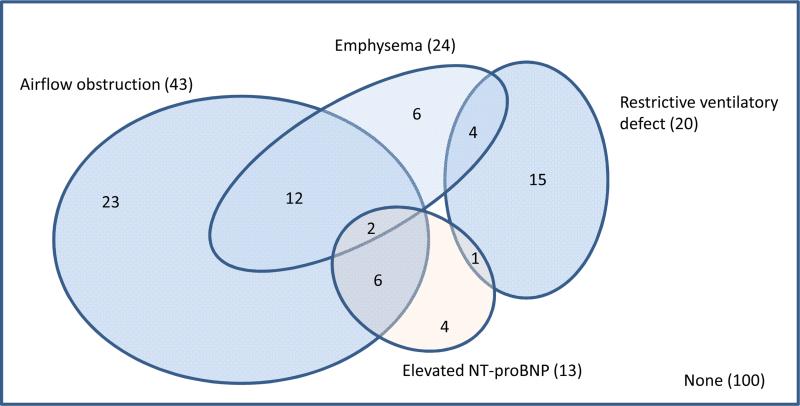
Figure 3.
Venn diagram for cardiopulmonary diagnoses, according to study test results, among participants with self-reported dyspnea (N=173).
Abnormal values were defined as follows: airflow obstruction as the ratio of forced expiratory volume in one second (FEV1) to forced vital capacity (FVC) < 0.7; restrictive ventilatory defect as percent predicted FVC less than 80% with a normal FEV1/FVC ratio; emphysema as percent emphysema > upper limit of normal; and elevated NT-proBNP as > 300 pg/ml.
Findings were similar when airflow obstruction was defined as FEV1/FVC < lower limit of normal, except the number of participants with airflow obstruction was smaller (N=26).

