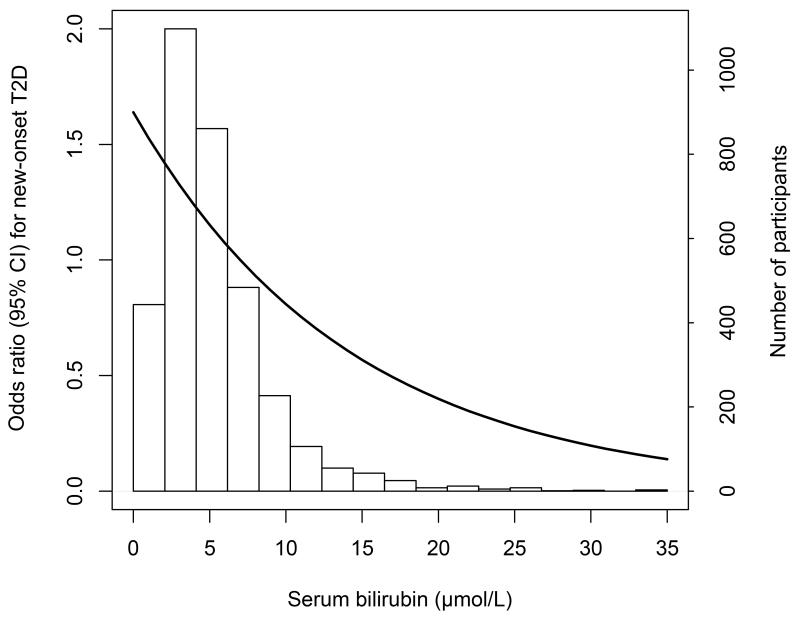
Figure 2. Histogram of serum total bilirubin levels with odds ratios for new onset (i.e., incident) type 2 diabetes over the range of bilirubin.
The number of participants represents by the white bars which correspond to the right axis. The solid line denotes the odds ratios which were centered on the median value of bilirubin.

