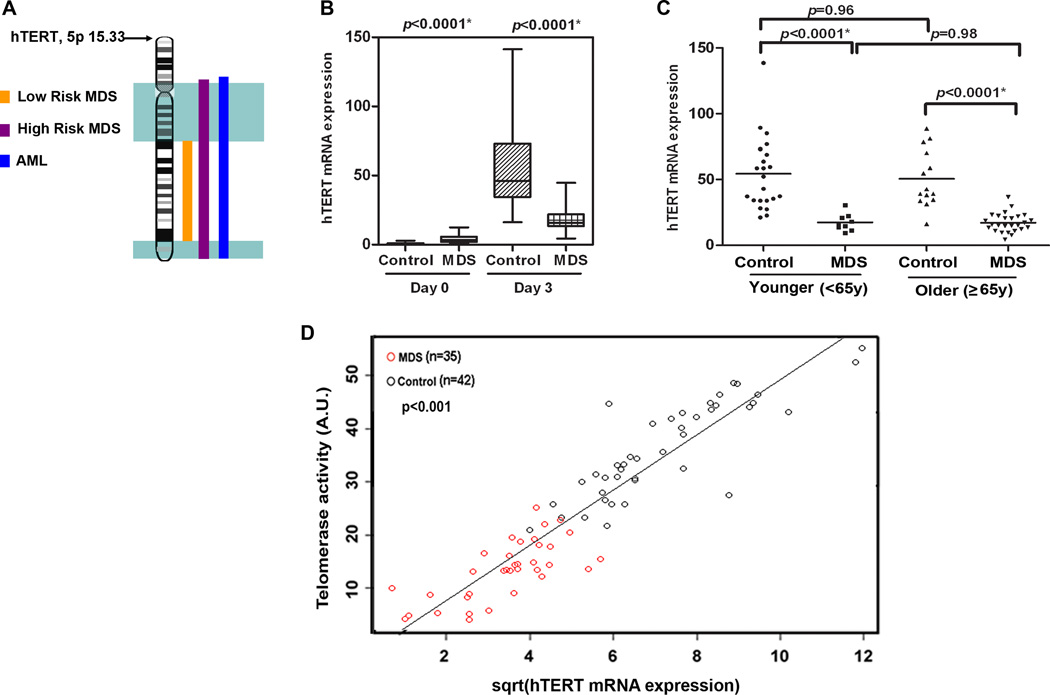
Figure 5. Telomerase insufficiency linked to defective hTERT transcription.
(A) Region on chromosome 5q that is commonly deleted in low risk (yellow) and high risk (pink) MDS and AML (blue) as well as the position of hTERT on 5p15.33. An aliquot of the purified CD3+ T-cells used in other assays from MDS patients (n=35) and healthy donors (n=42) were used to examine inducible hTERT mRNA expression as quantified by QRT-PCR on day 0 and day 3 after stimulation normalized to 18s ribosomal RNA. (B) Box and whisker plots of the relative mRNA expression on day 0 and day 3 after stimulation are shown. (C) Differences in inducible hTERT expression in younger and older groups of MDS cases and controls based on age <65y and ≥ 65y. (D) Inducible telomerase activity on Y-axis vs inducible hTERT mRNA expression in MDS patients (red circles) and healthy donors (black circles) reveals that these two variables were strongly correlated (r=0.89, p<0.001) by the Spearman rank correlation coefficient. Telomerase activity by the TRAP assay (data shown in Fig. 4) was normally distributed and square-root transformed hTERT mRNA expression was used for these analyses. Results were considered significant when p<0.05. Case-control differences for the hTERT expression in purified T-cells were compared using a Wilcoxon signed rank test with p-values shown at the top of each panel.

