FIGURE 4.

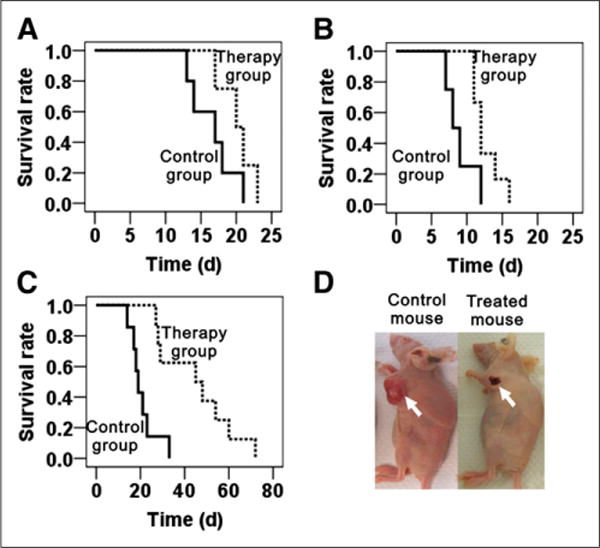
(A–C) Kaplan–Meier plot of time-to-sacrifice for therapy group (dotted line) and control group (solid line). (A) Group of mice inoculated with 1 million B16F10 cells. (B) Group of mice inoculated with 2 million B16F10 cells. (C) Group of A375M tumor models. Time is expressed in days from therapy. (D) Representative images of A375M tumor necrosis after 64CuCl2 treatment (left, control mouse; right, treated mouse).
