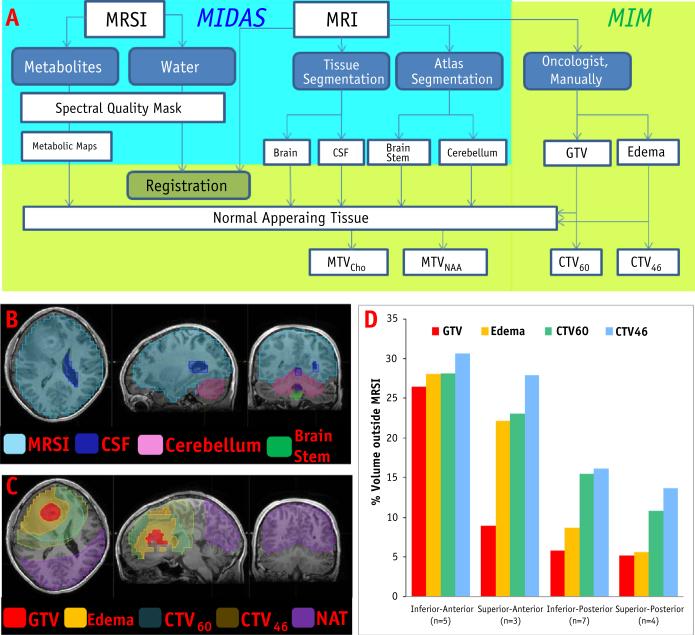
Fig. 1.
(A) Schema of workflow. Upper left-hand side (shaded in blue) denotes the steps carried out in MIDAS. Registration, radiation therapy (RT) volume contouring, and comparisons with metabolic tumor volumes (MTV) were performed with the MIM system. (B) Spectral quality mask (light blue), cerebrospinal fluid (CSF; dark blue), and brain segmentation (cerebellum and brainstem). (C) RT volumes and area of normal-appearing tissue (NAT). (D) RT volumes outside of the volume of magnetic resonance spectroscopic imaging within the “quality mask” (MRSIQ) based on tumor location. A color version of this figure available at www.redjournal.org.

