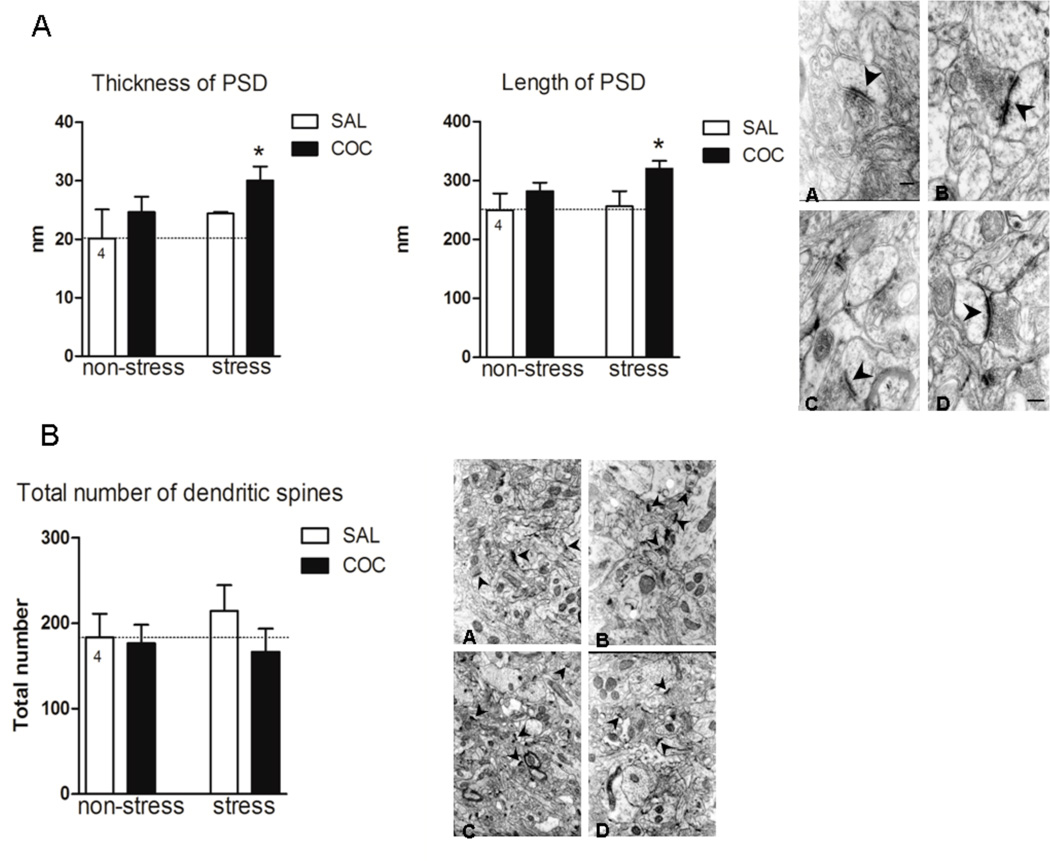
Figure 2.
Electron microscopy in the NAc. A, The length and thickness of PSD were measured in seven different fields for each animal under a magnification of 50,000 X. The length and thickness of PSD are expressed in nm as mean ± SEM. The results were analyzed by a two-way ANOVA (stress × drug) test. PSD length, stress F(1,14)=4.38, p=0.05; drug F(1,14)=20.25, p<0.001. *denotes p<0.05 compared to NS/SAL. PSD thickness, stress F(1,10)=5.20, p=0.045; drug F(1,10)=5.79, p=0.036. * p<0.05 compared to NS/SAL. The electron microphotograph depicted in A, shows the ultrastructure of PSD (arrows) of the NAc in all experimental conditions: (A) NS/SAL, (B) NS/COC, (C) S/SAL, (D) S/COC. Scale bar represents 100 nm. B, Dendritic spines were counted in forty different fields for each animal under a primary magnification of 12,500 X. Total number of dendritic spines is expressed as mean ± SEM. The electron microphotograph depicted in B shows the ultrastructure of the NAc neuropil in all experimental conditions: (A) NS/SAL, (B) NS/COC, (C) S/SAL, (D) S/COC. Scale bar represents 1 µm.

