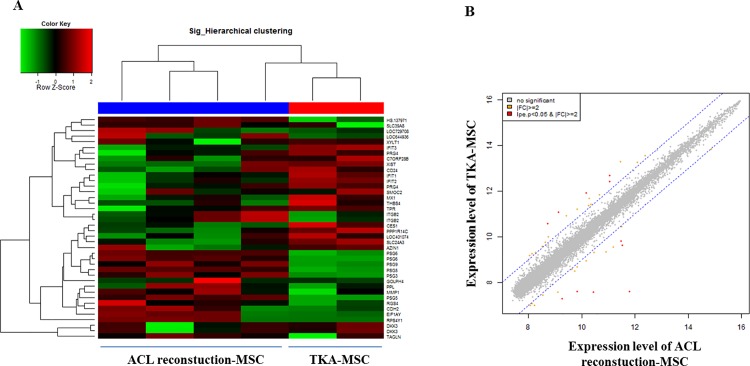
Fig 3. Microarray analysis of ACL-derived MSCs from the ACL reconstruction and total knee arthroplasty (TKA) groups.
(a) Hierarchical clustering of the total of 47,320 ACL-MSC transcripts in both groups. Red indicates upregulation and green downregulation. (b) Scatter plots showing the log ratios of the means of transcripts in ACL-derived MSCs from the TKA relative to the ACL reconstruction group. Red dots indicate a >2-fold induction (p < 0.05).

