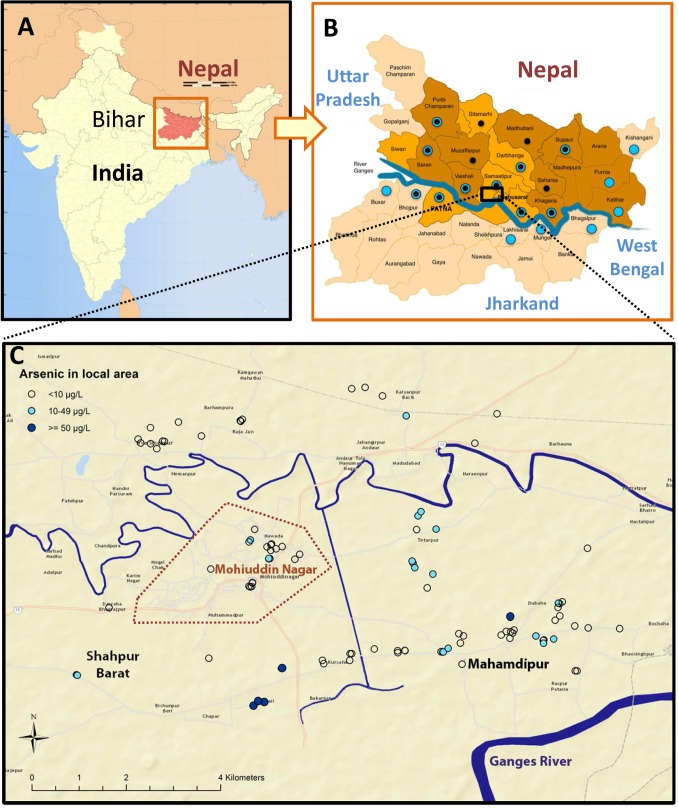
Fig 2. Map of study area.
A. The State of Bihar, India. B. District level map of Bihar with study area boxed. Districts with blue dots have had arsenic contamination previously identified and those with black dots have reported antimonial resistance in clinical isolates [10]. C. Mohiuddin Nagar block: study area showing the town boundary (dotted line). Each dot represents the mean arsenic level determined from 5 wells in each study subject’s local area.

