
Figure 2.
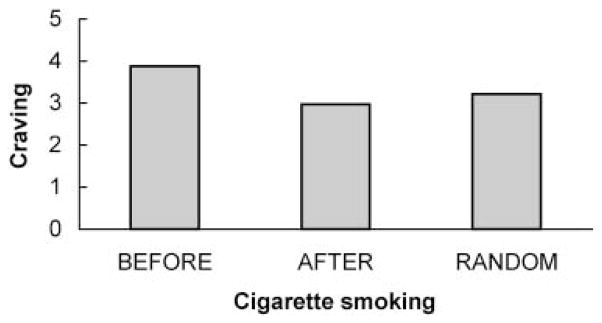
Mean negative mood scores by assessment type. Note: Standard error bars were omitted because the size of the standard errors (~.015) lacks visual utility. Also note that the y-axis has been truncated to illustrate the effect. Means and standard deviations were Before=2.22 (SD=.54), After 2.15, (SD=.54), and Random 2.23, (SD=.55). Before and Random means were not significantly different, but both were significant from After at the p<.05 level using Bonferroni adjustment.