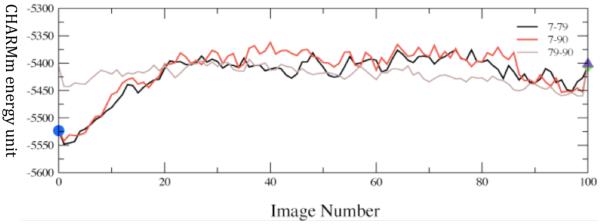
Figure 6a.

Converged average potential energies between stable, low-distance donor acceptor conformations. The energies are computed using finite temperature string methods. Numerical labels are arbitrary names given to clusters of conformations that structural analysis showed to be identical. The x-axis, which denotes conformational variation, is the string image number. Reprinted with permission from J. Chem. Phys. B. 10.1021/jp207876k 2011
