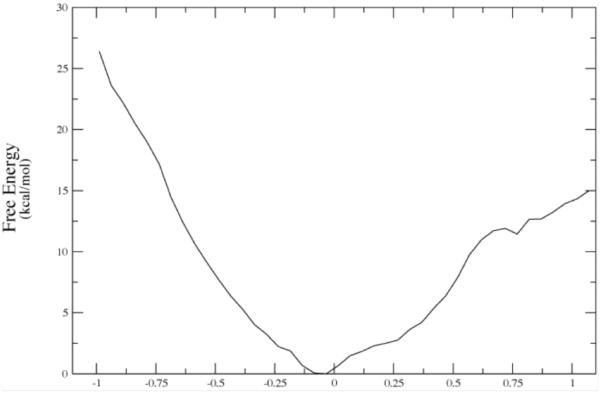
Figure 6b.
The converged free energy corresponding to one of the potential energy curves above (red curve labeled 7-90.) Note that the minima in average potential energy are on the edges of a rising free energy. The minima on Figure 6a given in string images correspond to −.50 and + .69 angstroms in Δ-RMSD units along the string coordinate on 6b. Reprinted with permission from J. Chem. Phys. B. 10.1021/jp207876k 2011

