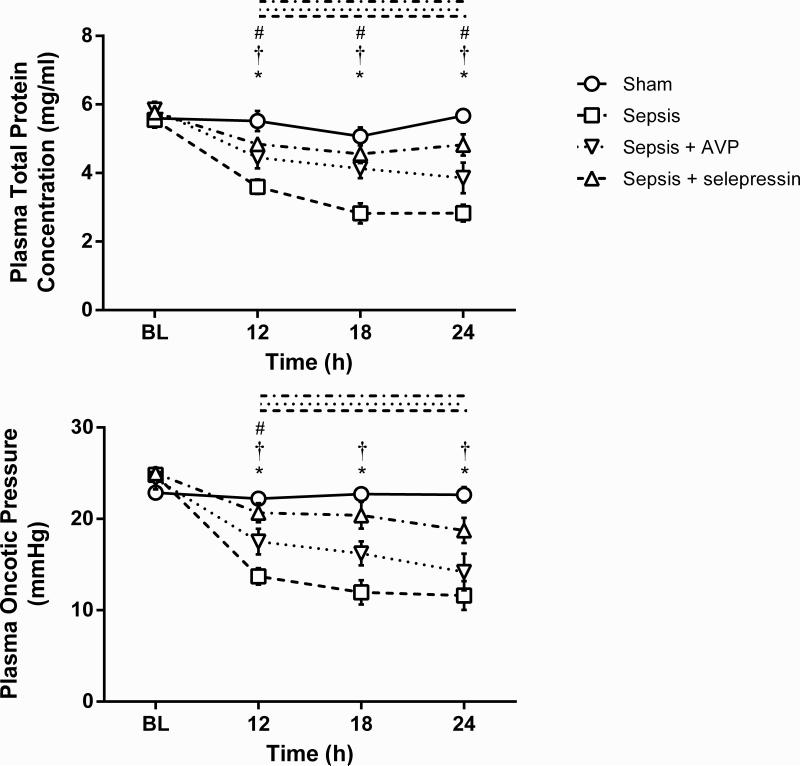
Figure 4.
Effect of AVP and selepressin on plasma total protein concentration and plasma oncotic pressure. Mean ± SEM are shown. BL: Baseline. Sham n = 6, Sepsis n = 10 14, Sepsis+AVP n = 8 10, Sepsis+selepressin n = 9. Significant change from BL (P < .05) is indicated by the lines above the graph shape coded according to legend for study groups. *: P < .05 for Sham vs. Sepsis; †: P < .05 for Sepsis+selepressin vs. Sepsis; #: P < .05 for Sepsis+AVP vs. Sepsis.

