
Figure 3. CA-RIT-NFAT1 directly upregulates gene expression by binding to promoter regions.
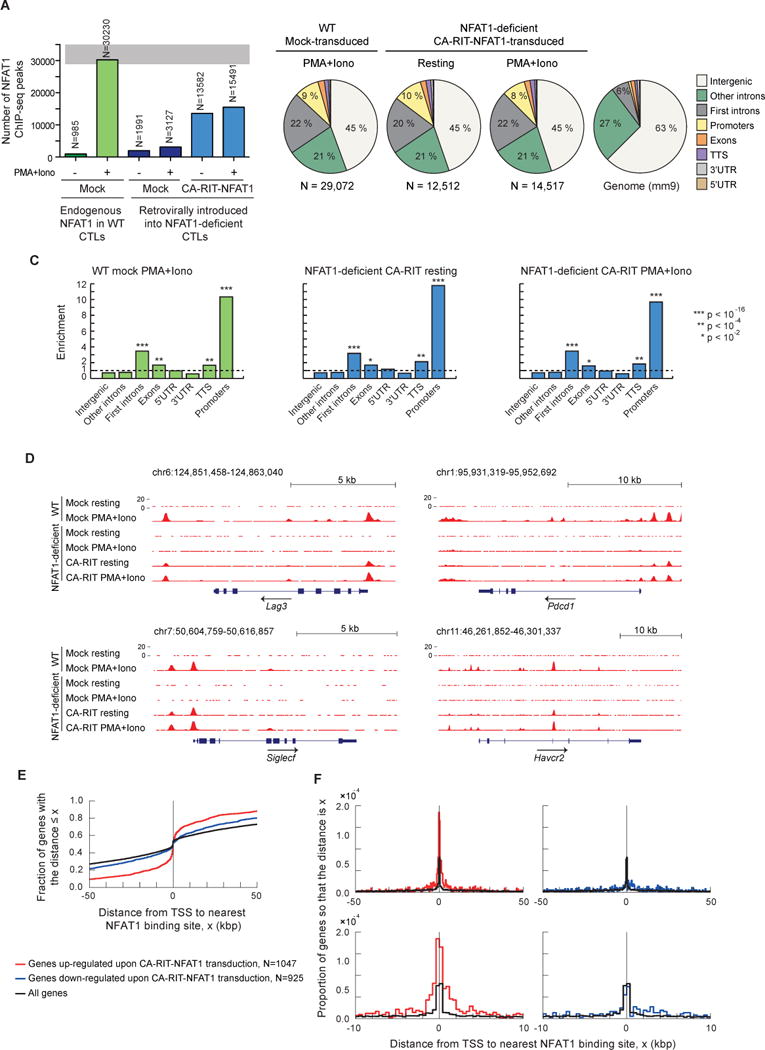
ChIP-seq results for endogenous NFAT1 in WT cells and for CA-RIT-NFAT1 in transduced NFAT1-deficient cells, either untreated or restimulated with PMA and ionomycin for 1h. (A) Number of NFAT1 and CA-RIT-NFAT1 ChIP-seq peaks identified by HOMER. (B) Pie charts show the genomic distribution of ChIP-seq peaks for endogenous NFAT1 in WT cells transduced with empty vector (left pie chart), or CA-RIT-NFAT1 ChIP-seq peaks in NFAT1-deficient cells transduced with CA-RIT-NFAT1 (middle two pie charts). Representation of the annotated regions in the mouse mm9 genome is shown for comparison (right pie chart). (C) Enrichment of NFAT1 binding sites in annotated genomic regions based on their relative abundance in the mouse genome (mm9). Statistical analysis was performed using Fisher’s exact test. ***, p<2e-16; ** p<1e-10; * p<1e-2. (D) Genome browser views of Lag3, Pdcd1 (encoding PD-1), Siglec5 and Havcr2 (encoding Tim3) loci showing the distribution of NFAT1 and CA-RIT-NFAT1 ChIP-seq peaks. (E–F) Cumulative plots (E) or probability per base pair (F) of the distance between the closest NFAT1 binding site relative to the transcription start site of all genes (black curves), genes significantly (p < 0.05) upregulated (red curves) or downregulated (blue curves) in NFAT1-deficient cells transduced with CA-RIT-NFAT1 in resting conditions. See also Figure S4.