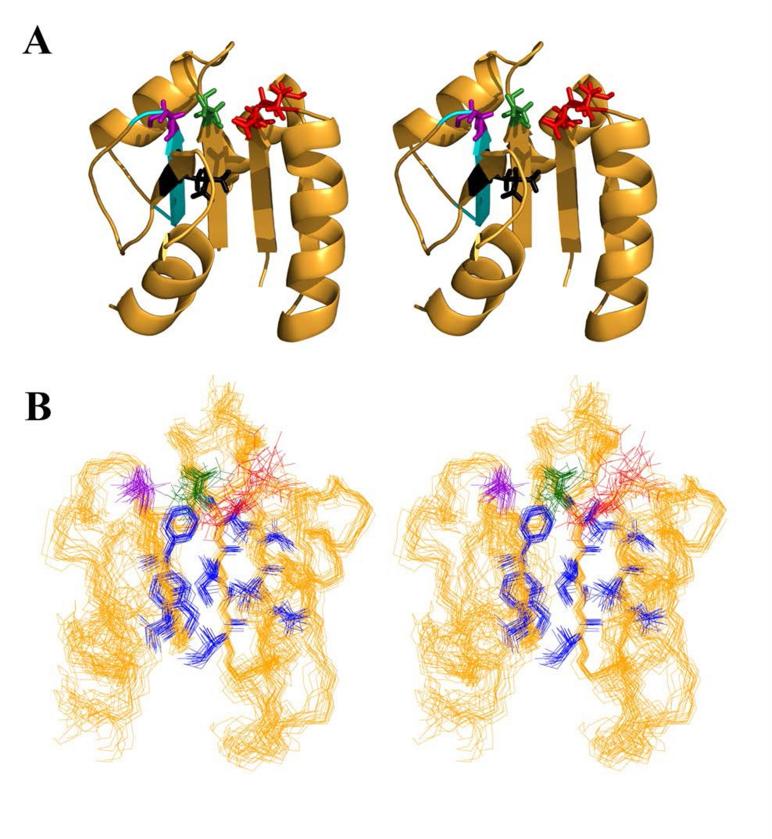
Figure 3.
Active site of Sma0114. (A) Stereo-diagram of the NMR structure of Sma0114 closest to the ensemble average, showing selected side-chains of active site residues: metal-ligands Glu15 and Asp16 in red, the phosphorylation site Asp60 in green, and Thr86 and Leu103 of the Y-T coupling pair in purple and black, respectively. The PFxFATGY motif is shown in cyan. (B) Stereo-view of the 20 lowest energy NMR structures of Sma0114 illustrating the precision of side-chains from different parts of the molecule. Side-chains comprising the hydrophobic core (blue) are well defined while those of active-site residues (color scheme as above) show poorer precision due to R2ex line-broadening.

