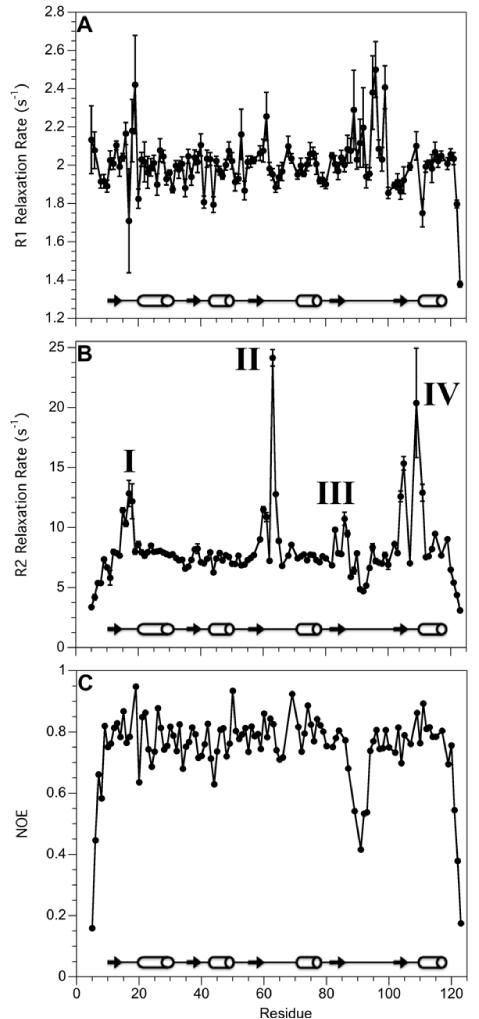
Figure 4.
15N NMR relaxation data for Sma0114. (A) R1 rates. (B) R2 rates. (C) 1H-15N NOE values. Error bars are shown for all data points but in some cases are smaller than the symbols used to depict the data. The secondary structure of Sma0114 is indicated with arrows (β-sheets) and cylinders (α-helices) in each panel.

