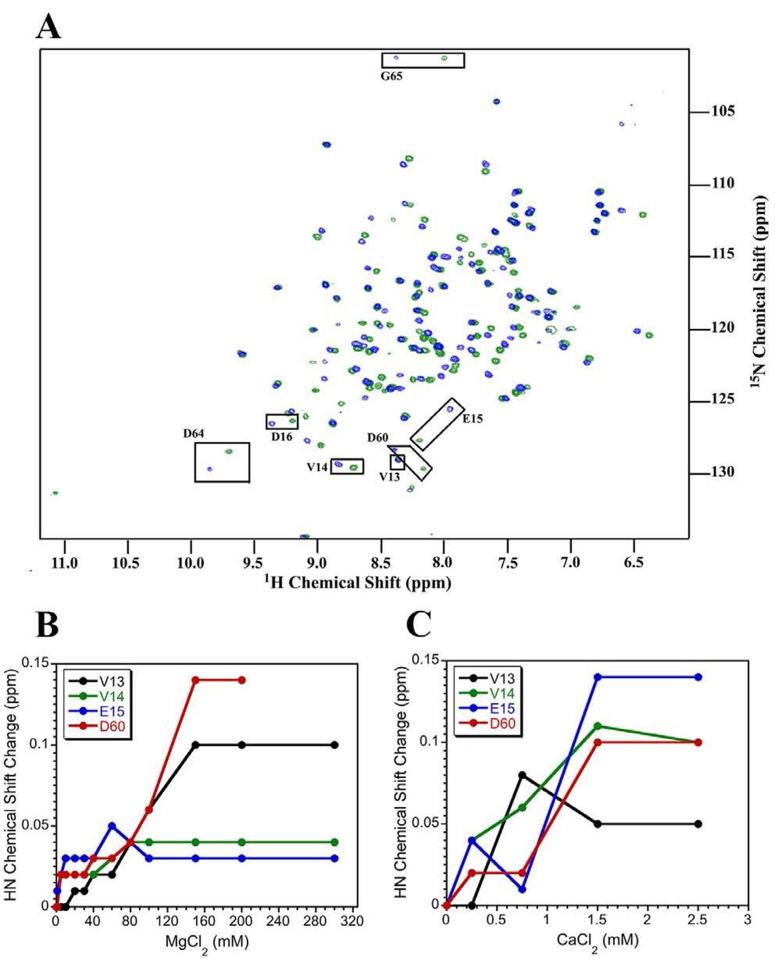
Figure 7.
Metal-binding of Sma0114 followed by NMR spectroscopy. (A) Superposition of 1H-15N-HSQC spectra for the apo (blue) and Ca2+-bound forms of Sma0114 (green). Active site residues that show the largest chemical shift perturbations and are indicated with black boxes. Titration curves for residues as a function of increasing MgCl2 (B) or CaCl2 (C) concentrations.

