
FIG. 6.
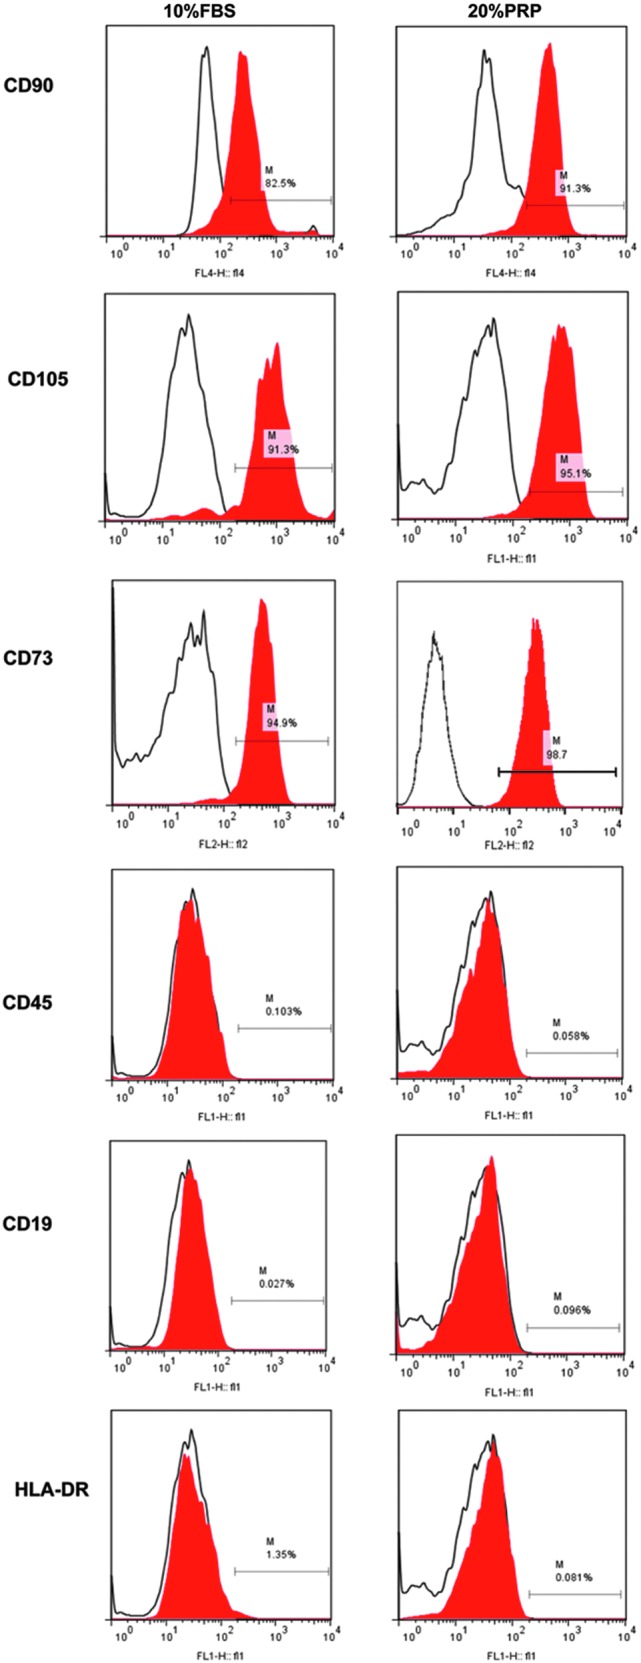
Analysis of surface marker expression. Phenotype of AT-MSCs cultured in 10% FBS or 20% nPRP was assessed by flow cytometry at passage 0. Isotype control antibody is shown by the black empty lines whereas the expressed markers are in red. “M bars” indicate the percentage of cells expressing the surface marker.