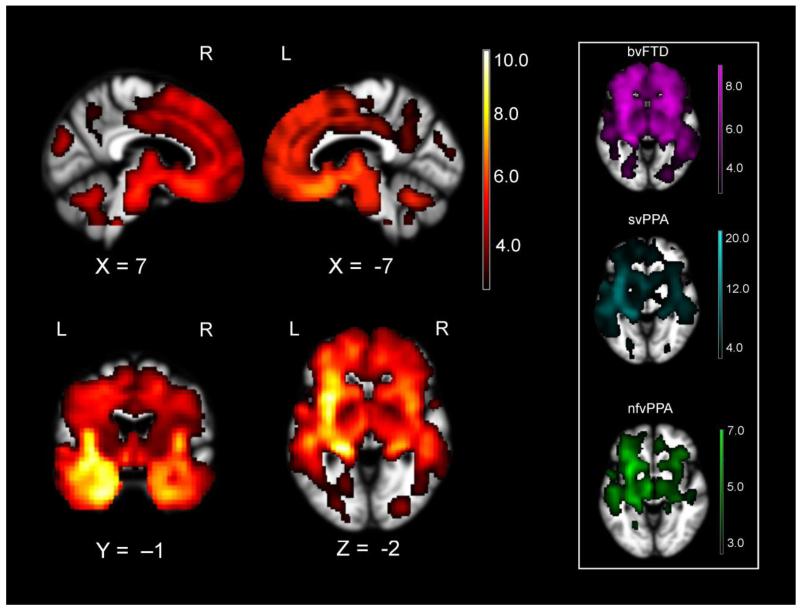
Figure 1.
The full FTD sample (FTD subtypes combined) had significant atrophy in left and right hemisphere emotion generating (e.g., amygdala, hypothalamus, and brainstem) and emotion regulating (e.g., orbitofrontal and ventrolateral prefrontal cortex) systems as compared to a sample of healthy controls (n= 34). The atrophy pattern for each clinical subtype separately versus healthy controls is displayed in the box of the right (bvFTD in violet, svPPA in cyan, and nfvPPA in green). Color bar represents T-scores (hot= pFWE<.05 according to study-specific permutation analysis) for regions with smaller volume in FTD when controlling for age, sex, field strength, handedness, and total intracranial volume.

