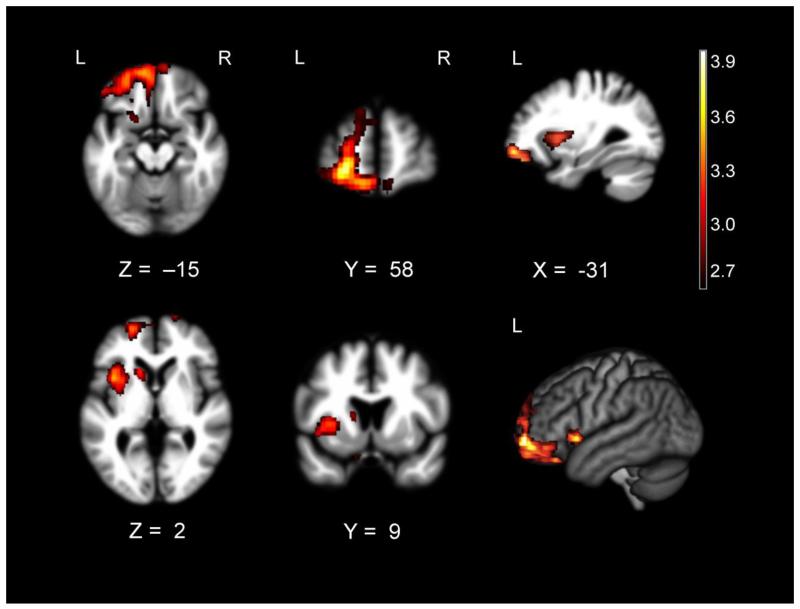
Figure 2.
T-score maps of brain areas for which volume loss was associated with higher levels of happiness behavior in patients with FTD (n= 96) when controlling for age, sex, CDR-SB, diagnosis, study wave, field strength, handedness, and total intracranial volume. Smaller volume in a cluster (Max T= 3.98) that included left ventrolateral and orbitofrontal cortex; left anterior insula, striatum, rostromedial prefrontal cortex, and superior frontal gyrus; and bilateral gyrus rectus was associated with higher happiness behavior after correction for Type 1 error (pFWE<.05). Color bar represents T-scores (hot= pFWE<.05 according to study-specific permutation analysis, T> 2.63). Results for all analyses are overlaid on the warping template from DARTEL.

