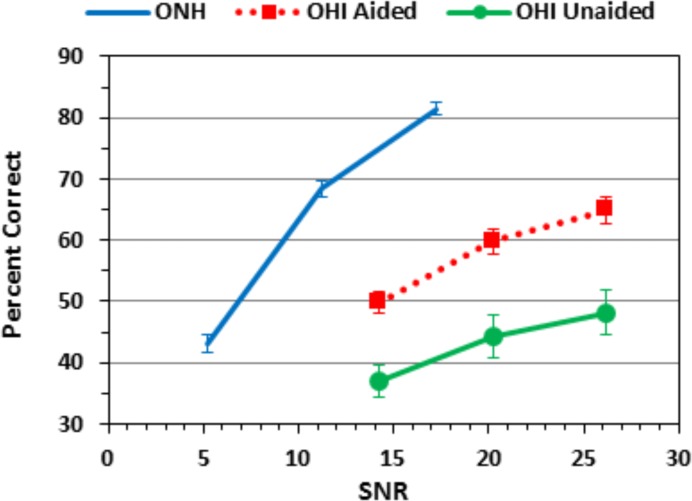
Fig 2. Percent correct scores for the ONH listeners (gray) and for aided (red) and unaided OHI (green) listeners averaged over all consonants in onset and coda positions.
The horizontal positions of the curves were determined by the mean levels of SNRs for ONH and OHI listener groups. Error bars show standard errors.

