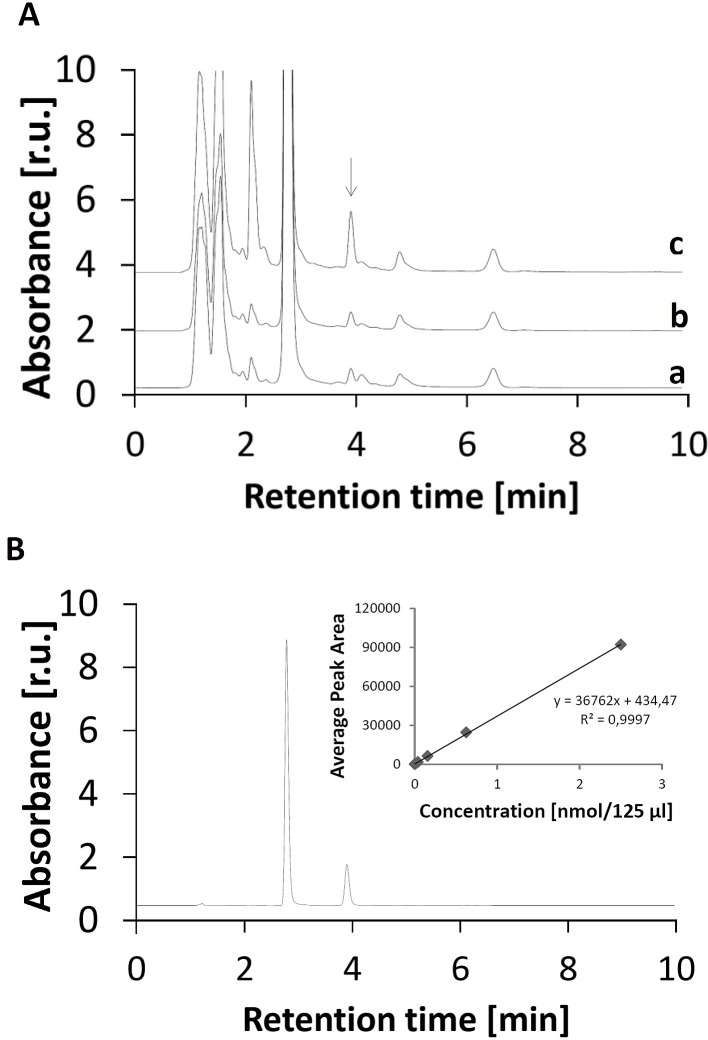
Figure 3. Detection of lipid peroxidation product malondialdehyde by HPLC analysis.
The chromatogram of DNPH-MDA complex in U937 cells (A) and DNPH-MDA standard (B). In A, chromatogram of DNPH-MDA complex was measured in the control (trace a), the H2O2-treated (trace b) and the Fenton reagent-treated (trace c) U937 cells. The U937 cells were treated with 5 mM H2O2 (b) and Fenton reagent (5 mM H2O2 and 1 mM FeSO4) (c) for 30 min. After the treatment, lipids were separated from proteins and DNPH was added to lipids. In B, the chromatogram of DNPH-MDA standard shows the retention time of 3 min 50 s. The insert shows the dependence of average peak area on the concentration of DNPH-MDA standard. Based on the calibration curve, the concentrations of DNPH-MDA complex determined from calibration curve were as following: 0.029±0.003 nmol ml−1 (control), 0.030±0.003 (H2O2) and 0.09±0.02 nmol ml−1 (Fenton reagent). The coefficient of determination R2 was determined as 0.9997. Data are presented as mean values and standard deviations. The mean value represents the average value from at least three measurements.

