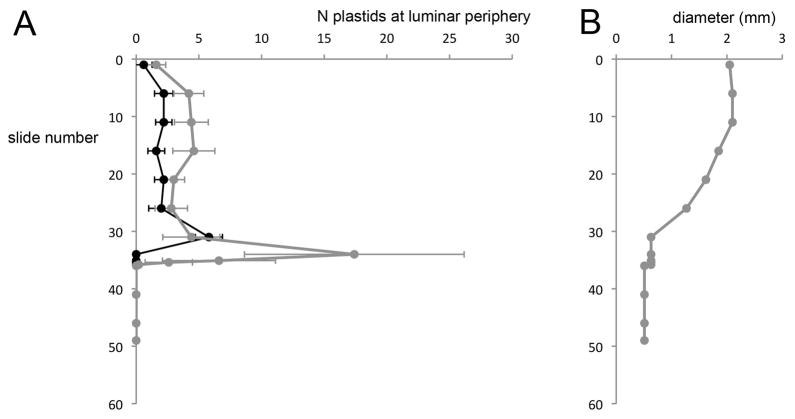
Figure 2.
Plastid abundance along the length of a segment of mature sporophyte, from the mid-hypophysis to the distal end of the seta, in a representative specimen of S. ampullaceum. Trends from two other specimens are similar. (A) The number of plastids (average ± SE of the mean, N = 5 counts per slide) visible along the periphery of luminar space in either the epidermis and cortex (grey) or central strand (black) in serially sectioned tissues, from the mid-hypophysis (slide number 0) to a few mm below the proximal end of the hypophysis (slide number 49). (B) Corresponding diameter of the sporophyte cross-section for each slide used in plastid quantifications, providing an indication of the distance along the sporophyte (i.e. from the enlarged midpoint of the hypophysis to the thin seta).

