
Figure 4. Positive and Inverse Group PPI Maps.
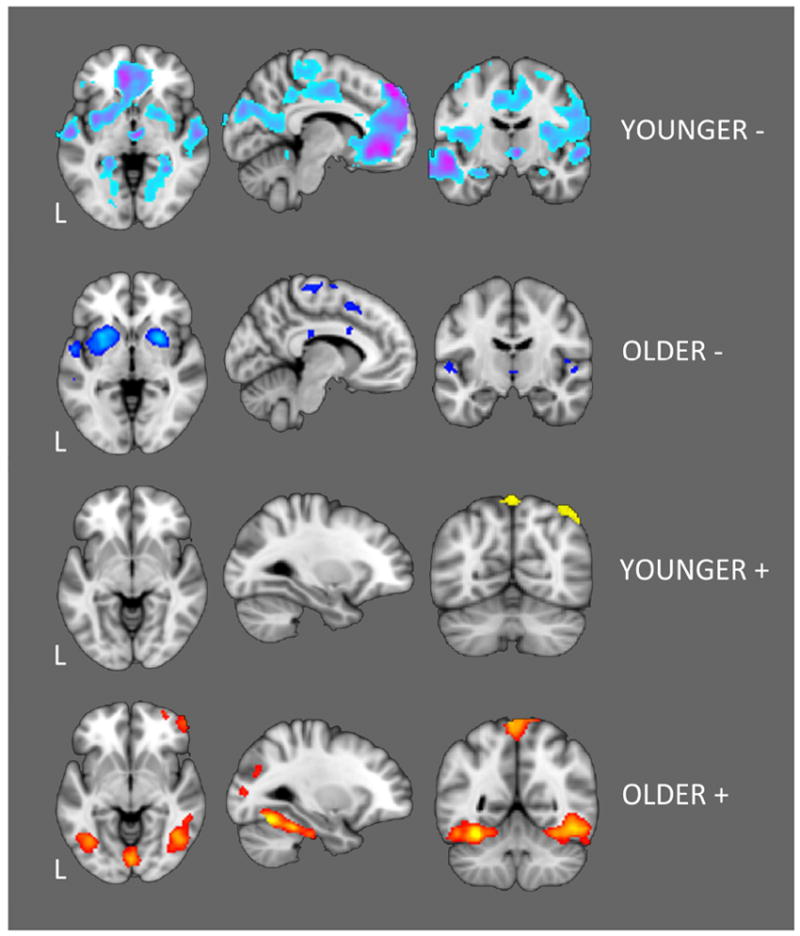
Younger adults tended to show widespread inverse fC between left DLPFC and task-negative regions whereas older adults tended to show widespread positive fC with task-positive areas of ventral primary and association visual cortices. The results presented in this figure provide an overview of within-group connectivity patterns. However, apparent between-group differences may in part reflect thresholding effects and should thus only be interpreted in the direct comparison results shown in Figure 5.