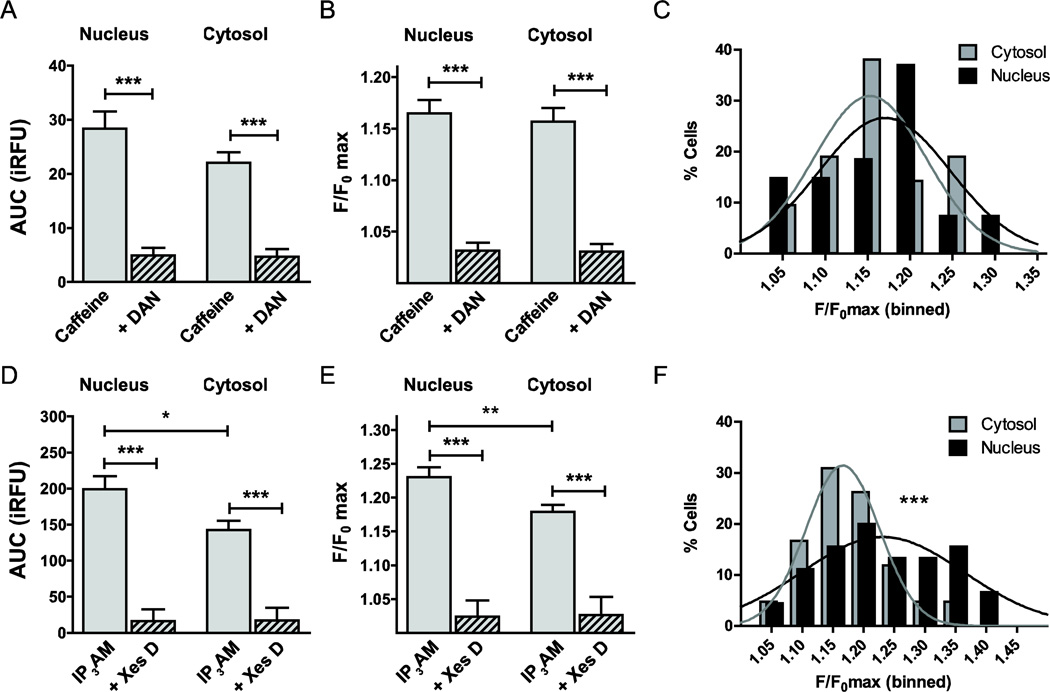
Figure 6. Subcellular localization of stimulus-induced intracellular Ca2+ release.
Given the differential subcellular localization of ICCs on the membranes of ER or the membranes of the nuclear envelope, we performed a subcellular analysis of our Ca2+ imaging data. No statistically significant difference was identified between nuclear and cytosolic Ca2+ release upon caffeine stimulation, neither at the level of AUC (A) nor F/F0 max (B). DAN blocked caffeine-mediated Ca2+ release similarly in both regions (A, B). Amplitudes of the RyR-mediated Ca2+ transients binned at 5% intervals are Gaussian normally distributed, and the distributions for not statistically significantly different between cytosol and nucleus (P=0.41; C). In contrast, AUC of IP3R-mediated Ca2+ release was 39% higher in the nucleus compared with the cytosol (n=42, P<0.05; D). Similarly, F/F0 max was 28% higher in the nucleus vs. the cytosol (n=42, P<0.05; E). Both, binned nuclear and cytosolic F/F0 max amplitudes could be fitted with a Gaussian distribution and were highly significantly different (P<0.001; F).

