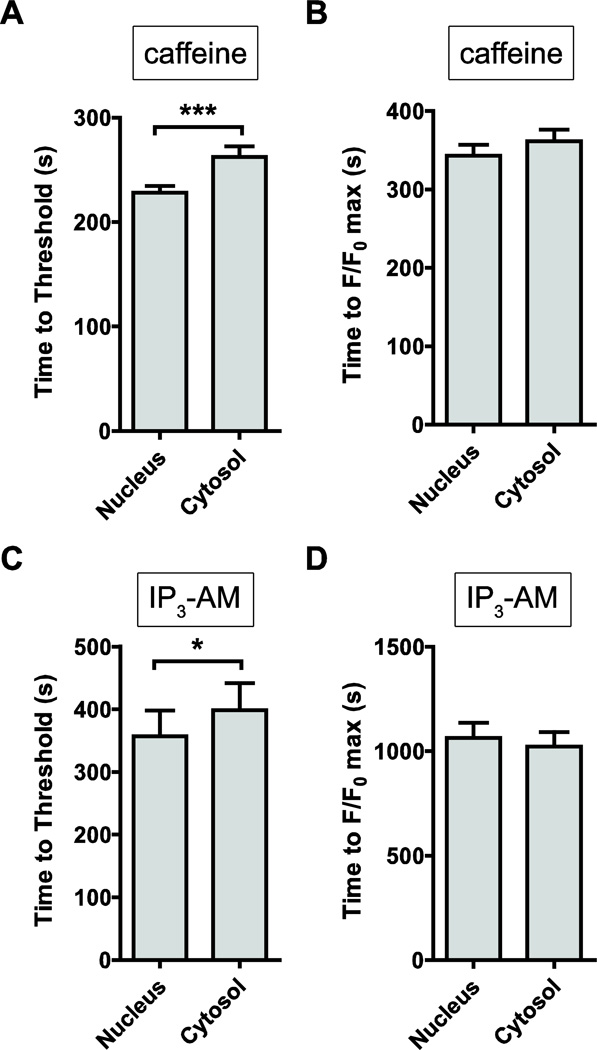
Figure 7. Kinetic analysis of IP3- and caffeine-stimulated intracellular Ca2+ responses.
We measured the kinetic responses of the increase in intracellular Ca2+ concentration, following exposure to the agonists, IP3-AM and caffeine. (A) Time to reach the 5% threshold was significantly faster for nuclear responses, compared with cytosolic responses (228.1 ± 6.4 sec vs. 262.5 ± 10.0 sec, n=32, P<0.01). (B) Similarly, time to peak (F/F0 max) was faster for nuclear vs. cytosolic responses (343.3 ± 13.7 sec vs. 361.6 ± 14.7 sec, n=32, P<0.001), indicative of significant nuclear localization of RyR2 receptors. (C) IP3-AM stimulation resulted in a faster nuclear response to threshold, compared with cytosolic kinetics (357.1 ± 41.0 sec vs. 398.4 ± 43.5, n=46, P<0.05), supporting evidence for significant expression of nuclear IP3R2 receptors in the membranes of the nuclear envelope. (D) In contrast, time to peak (F/F0 max) was similar between nuclear and cytosolic responses (1063 ± 72 sec. vs. 1023 ± 68 sec, n=46, P=0.69).

