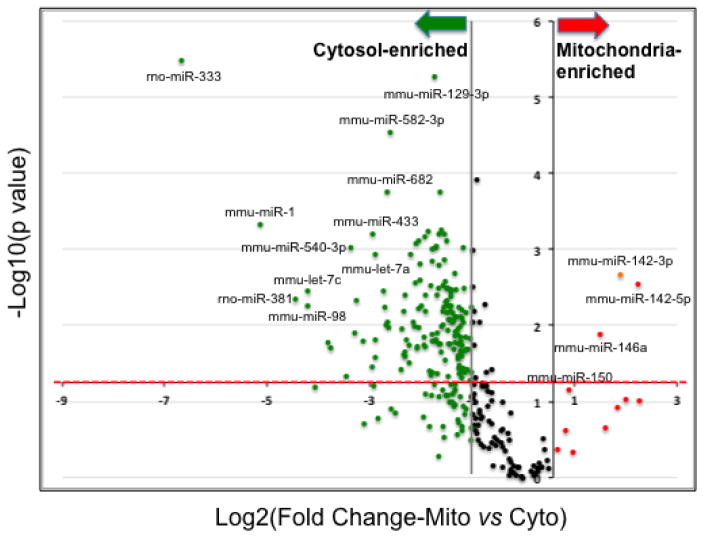
Figure 4. Differential miRNA enrichment in cytosol and mitochondria.
Volcano plot of RT-qPCR array data displayed differential miRNA enrichment in cytosol and mitochondria. Each data point was plotted as the level of fold change (Log2(Fold Change—Mito vs Cyto)) on the X-axis and corresponding statistical level of significance (−log10(p value)) on the y-axis. Fold change=2^ −(CtMito − CtCyto). Mitochondria-enriched miRNAs with a more than 2 fold change were colored in red; likewise, cytosol-enriched miRNAs that having a change more than 2 fold were colored in green. Data points above the red-dashed-line are statistically significant (p < 0.05). The numeric data set of this plot is provided in Suppl. File 2.

