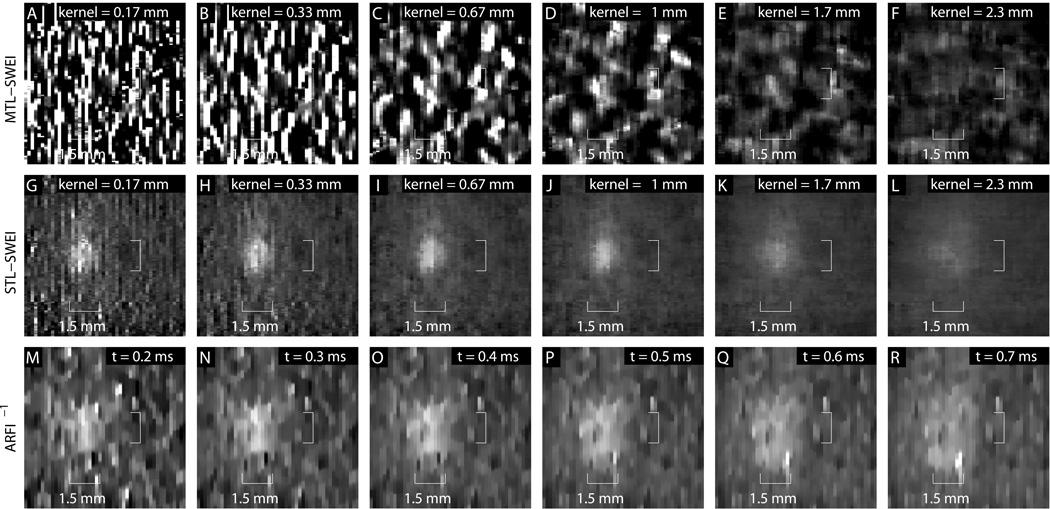
Figure 12.
MTL-SWEI [A–F], STL-SWEI [G–L], and ARFI [M–R] images of the 1.5 mm, Type IV (GqEI = 6.48 kPa) inclusion at different regression filter values (for SWEI) and different time steps (for ARFI). The dynamic range and field of view have been reduced to improve inclusion visualization. Unlike the other figures, no median filter has been used in these images to highlight appreciation of the noise levels and edge resolution, though it is applied for the computation of the parameters in figure 13. The target is most clearly visualized and correctly sized in STL-SWEI.

