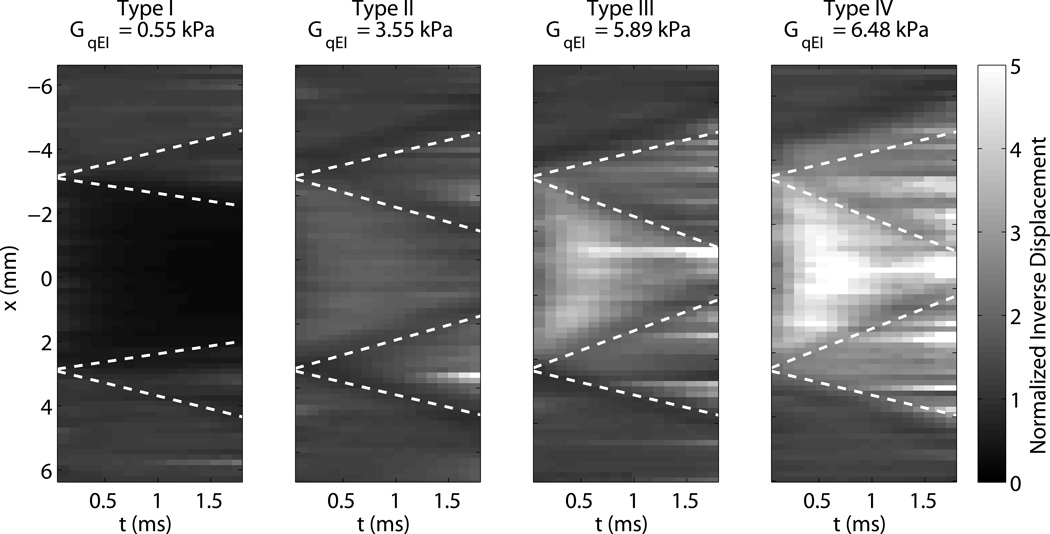
Figure 5.
Evolution of inclusion boundaries through tracking time for each of the 6 mm targets in normalized inverse ARFI. Lines representing half of the expected shear wave speed in each medium are drawn propagating from each boundary. The Type IV inclusions corresponds to the data shown in figure 4.

