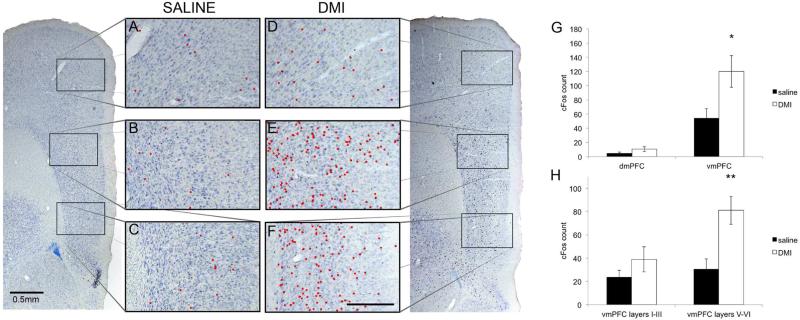
Figure 3.
Animals were injected with saline (A-C) or DMI (D-F) (i.p., 10 mg/kg) at 10:00am and sacrificed two hours later. Cells in the mPFC expressing cFos are indicated by red dots in the anterior cingulate (A and D), prelimbic (B and E), and infralimbic (C and F) cortices. The prelimbic and infralimbic cortices, collectively called the vmPFC below, show a dramatic increase in cFos expression following drug administration whereas the anterior cingulate (dmPFC) is relatively quiet. Scale bar in F indicates 0.25mm. G The vmPFC, but not the dmPFC, was significantly activated upon DMI injection (i.p. 10 mg/kg, n=5) compared to saline-injected animals (n=5). H Within the vmPFC, there was a clear distinction in the number of cFos-stained cells between the deep layers (V-VI) and superficial layers (I-III).

