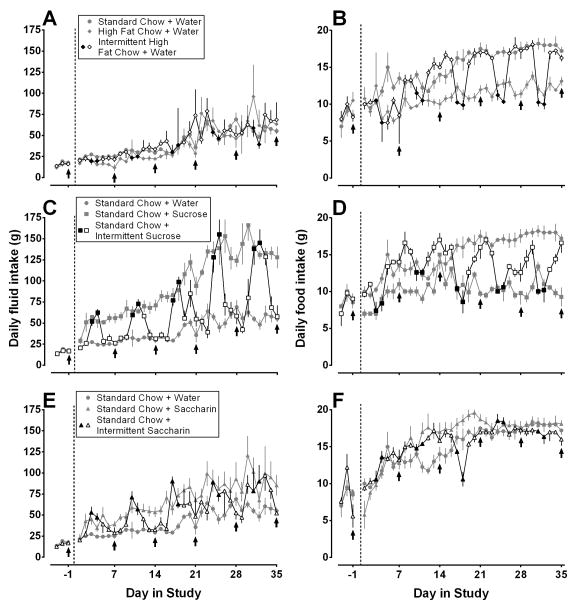
Fig 1.
Mean (± SEM) daily fluid (A, C, E) and food (B, D, F) intake throughout the study (g). Data to the left of the vertical dashed lines are from baseline conditions when all rats ate standard chow and drank water. Thereafter (to the right of the dashed lines), rats were assigned to the following feeding conditions: panels A and B) continuous access to water and either continuous access to standard chow (gray circles, n=4), continuous access to high fat chow (gray diamonds, n=4), or intermittent access to high fat chow (black [high fat chow 2 days per week] and white [standard chow 5 days per week] diamonds, n=4); panels C and D) continuous access to standard chow and either continuous (gray squares, n=5) or intermittent (black [sucrose 2 days per week] and white [water 5 days per week] squares, n=5) access to a 10% sucrose solution; panels E and F) continuous access to standard chow and either continuous (gray triangles, n=5) or intermittent (black [saccharin 2 days per week] and white [water 5 days per week] triangles, n=5) access to a 0.1% saccharin solution. Gray circles in panel A are repeated in panels C and E and those in panel B are repeated in panels D and F. Cocaine tests are indicated by arrows. Vertical axes: fluid or food consumption in g. Horiontal axes: day in study.

