
Figure 3. PKC inhibition suppresses single stimulus eEPSCs in both D1DR- and D2DR-positive NAc shell MSNs.
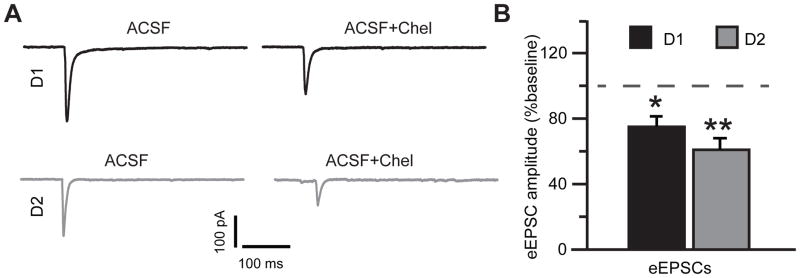
(A) eEPSC average traces from the same D1DR- and D2DR-positive cell in the absence and in the presence of PKC blockade. Stimulus artifacts were removed for illustration. (B) Peak amplitude of eEPSCs in D1DR- and D2DR-positive MSNs in the presence of PKC blockade is plotted as a percent of response recorded prior to PKC antagonist application. Note similar inhibition of eEPSC amplitude in both cell types (paired Student’s t-test, *, p<0.05; **, p<0.01; n=8–9 cells from 3 animals).