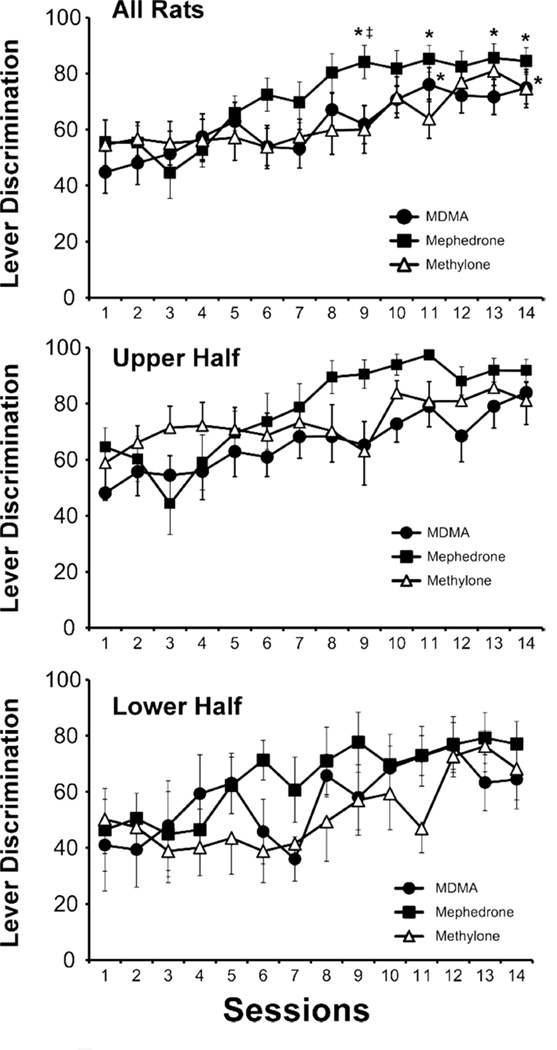
Figure 3.
Mean drug-associated lever discrimination ratios during acquisition are presented for all animals in the three groups (upper panel) as well as for the upper (middle panel) and lower (lower panel) median halves. Significant difference from the first session within group by *, Between mephedrone and both other groups by #, versus methylone by ‡ and versus MDMA by †

