
Figure 1. Quantification of three cell populations in rotator cuff biopsies.
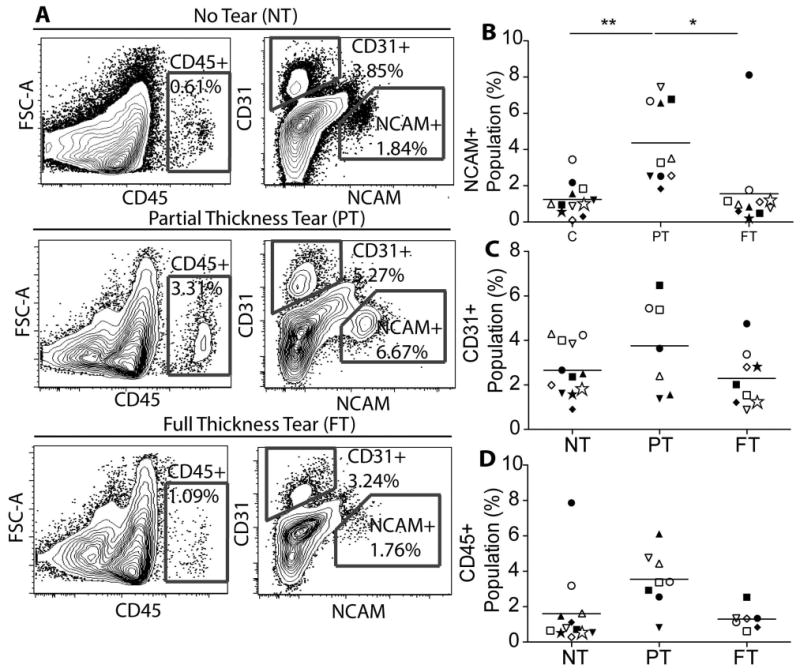
A) Representative flow cytometry contour plots of isolated cells labeled with three population specific fluorescent antibodies: NCAM (skeletal muscle progenitor cells), CD31 (endothelial cells), and CD45 (inflammatory cells). B) Quantification of the percentage of the NCAM+ (skeletal muscle progenitor) cell population relative to all single cells. Quantification is based on the gray gates shown in panel A and in Supplementary Figure 1A. Within each category, individual patient data are indicated by different symbols. Closed symbols indicate supraspinatus data and open symbols indicate infraspinatus data. ** p < 0.01.