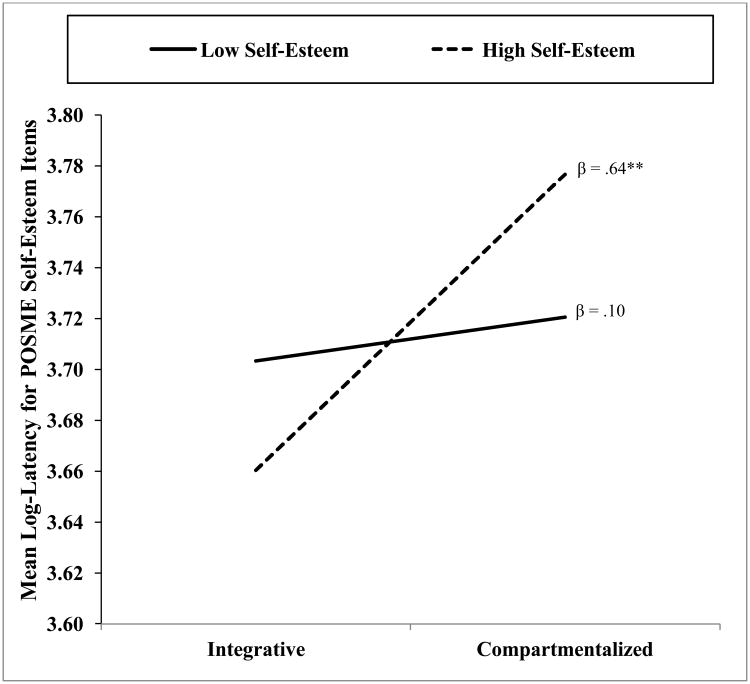
Figure 3.
Self-esteem accessibility of POSME items (i.e., mean log latencies for describes-me responses to positively-worded self-esteem items [Rosenberg, 1965]). Predicted values illustrate the interaction of evaluative organization and self-esteem at values that are one standard deviation above and below their respective means. Higher scores reflect longer latencies. Beta weights represent simple slopes analyses.
**p ≤ .01

