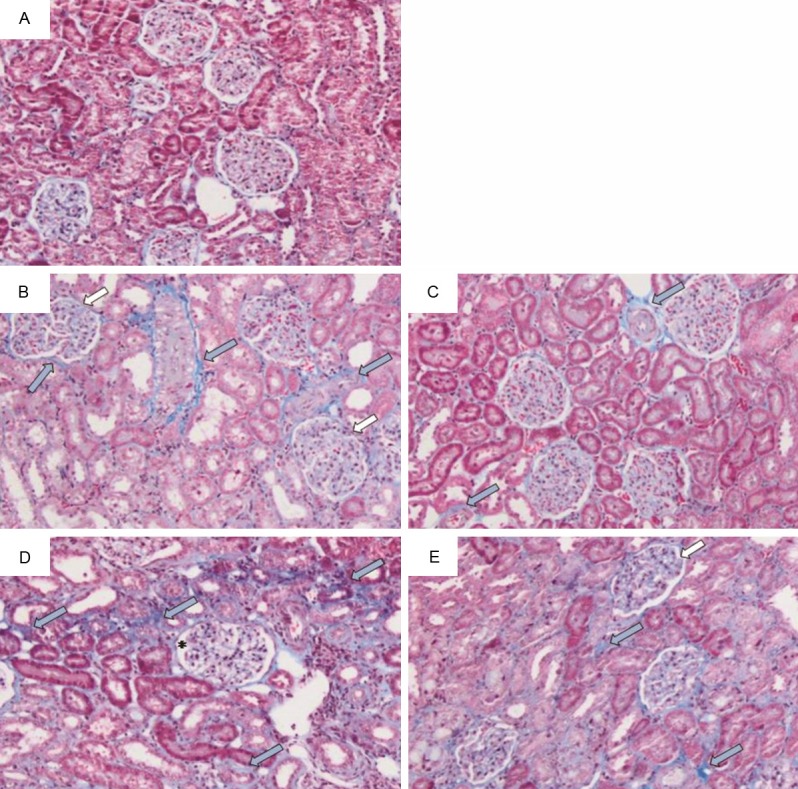
Figure 6.

Representative photographs of sections of renal tissue from rats treated for 28 days with: (A) saline (control), (B) adenine injected intraperitoneally, i.p., (50 mg/Kg), (C) adenine i.p. (50 mg/kg) + GA (15% w/v, in drinking water), (D) adenine i.p. (100 mg/Kg), and (E) adenine i.p. (100 mg/kg) + GA as above. The photographs show the presence of fibrosis (thick blue arrow), glomeruli with mesangial expansion (thick white arrow), and golermuli showing capillary widening (asterisk). Staining was carried out with Masson’s trichrome stain.
