
Figure 7.
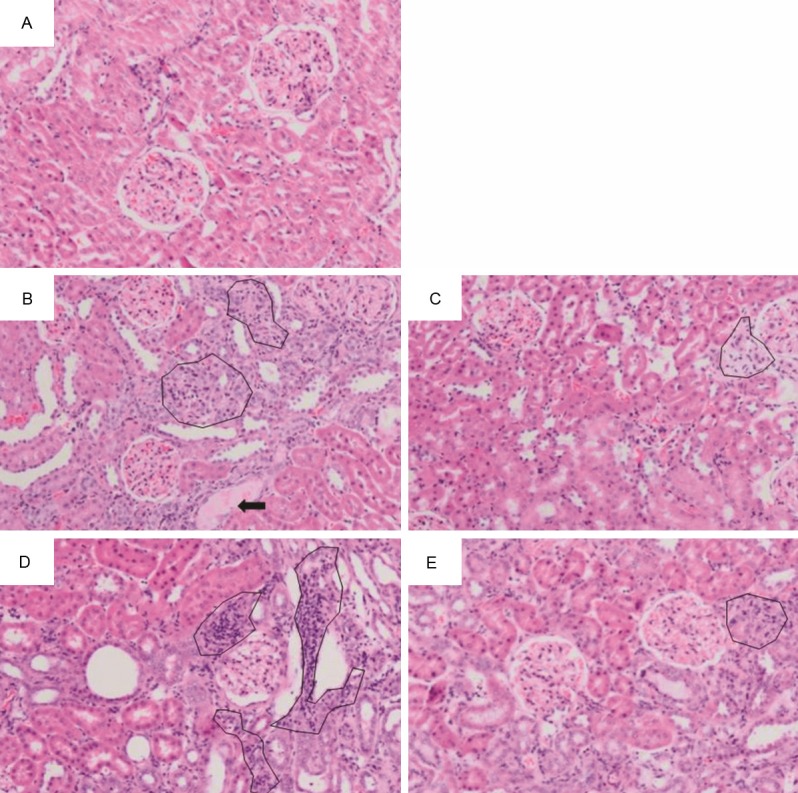
Representative photographs of sections of renal tissue from rats treated for 28 days with: (A) saline (control), (B) adenine injected intraperitoneally, i.p., (50 mg/Kg), (C) adenine i.p. (50 mg/kg) + GA (15% w/v, in drinking water), (D) adenine i.p. (100 mg/Kg), and (E) adenine i.p. (100 mg/kg) + GA as above. The photographs show the presence of tubular dilatation (thick black arrow), and inflammation (circles). Staining was carried out with hematoxylin and eosin.