
Figure 2.
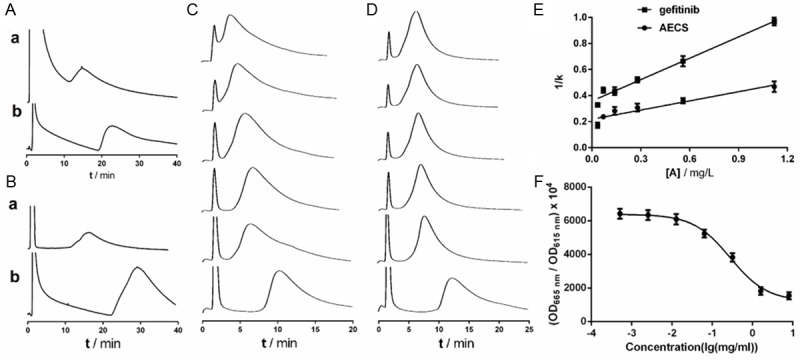
Effect of drugs on the EGFR. The CMC chromatograms of AECS (a) and gefitinib (b) on the HEK293/EGFR CMC column (A) and A431 CMC column (B). Elution profiles of gefitinib on the HEK293/EGFR CMC column with different concentrations of ligands (gefitinib (C) and AECS (D)) in the mobile phase and regression curves achieved by plotting 1/k versus [A] (E). The six concentrations were 0.035, 0.07, 0.14, 0.28, 0.56 and 1.12 mg/L (from bottom to top). Each point with a bar represents the mean ± SEM (n=5). The chromatographic conditions were as follows: CMC column 10 mm×2.0 mm; flow rate 0.2 mL/min; column temperature 37°C; mobile phase 2 mM phosphate-burred saline, pH 7.4. (F) Effect of AECS on the EGFR kinase activity. Initially, 4 μl variable concentrations of AECS (diluted in kinase buffer), 2 μl EGFR kinase, 2 μl substrate and 2 μl ATP were separately added to a 384-well plate and the reaction was allowed to proceed at 37°C for 30 min. The TK-Antibody (5 μl) labeled with Eu3+-cryptate and streptavidin-XL665 (5 μl) was then added with EDTA to the assay plate at room temperature for 1 h. Then the fluorescence was measured using the Perkin-Elmer victor 2030 multilabel plate reader. The results were calculated as follows: ratio=(OD665 nm/OD615 nm)×104. The values represent the average of three independent experiments. Values represent means ± SEM (n=3).