
Figure 5.
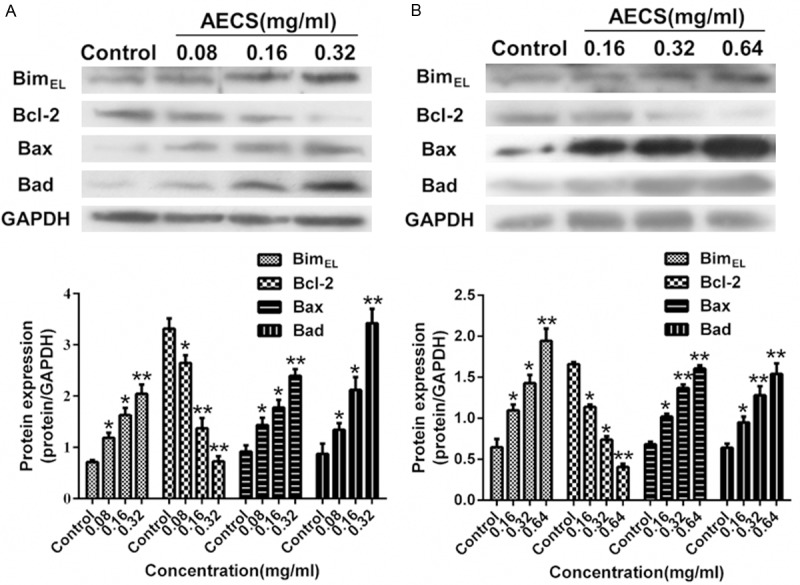
Effects of AECS on BimEL, Bcl-2, Bax and Bad expressions in high-EGFR expression cells. A. Expression levels of BimEL, Bcl-2, Bax and Bad in A431 cells treated with AECS (0, 0.08, 0.16 and 0.32 mg/ml) for 48 h were examined by western blot assay, and the results were quantified by densitometry analysis of the bands and normalization to GAPDH. The values represent the average of three independent experiments. The samples derive from the same experiment and that blots were processed in parallel. B. Expression levels of BimEL, Bcl-2, Bax and Bad in HEK293/EGFR cells treated with and AECS (0, 0.16, 0.32 and 0.64 mg/ml) for 48 h were examined by western blot assay, and the results were quantified by densitometry analysis of the bands and normalization to GAPDH. The values represent the average of three independent experiments. The samples derive from the same experiment and that blots were processed in parallel. Data represents the means ± SEM. *p < 0.05, **p < 0.01 versus the control.