Figure 1.

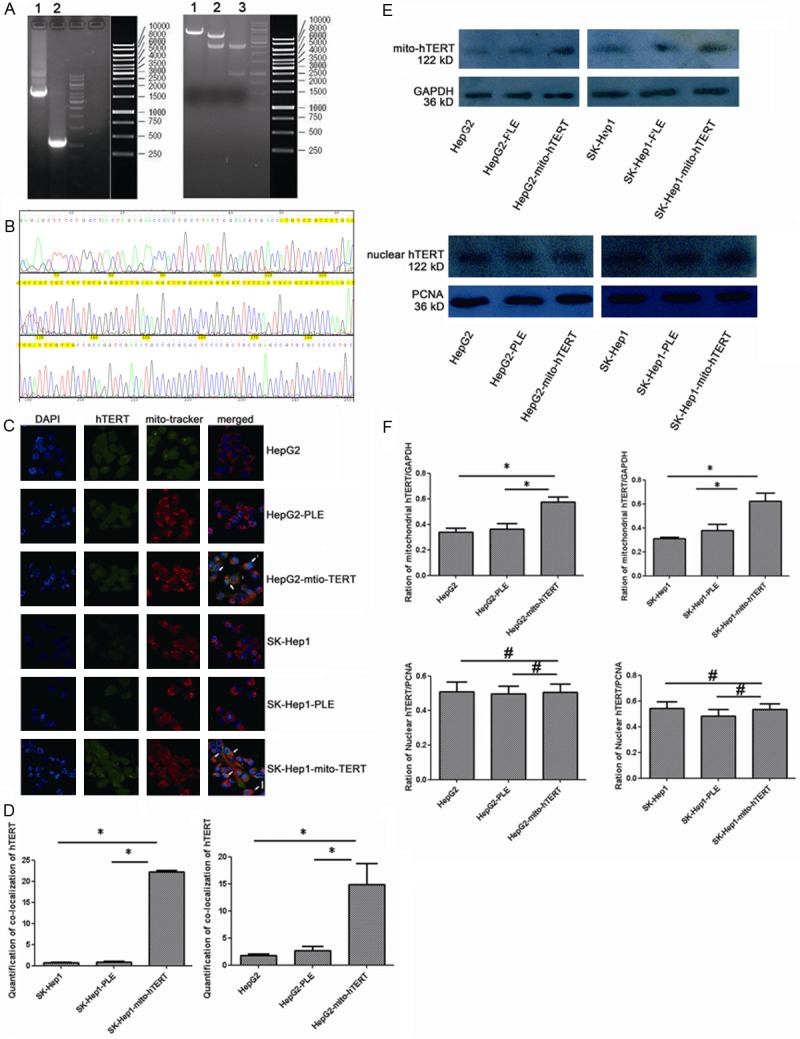
Increased expression of mito-hTERT in cells after transfection with PLeno-mito-hTERT-GTP lentivirus (A)Agarose Gel Electrophoresis of Plasmid DNA. Left Lane 1: MTS-hTERT (4000 bp). Left Lane 2: PDOWN-vehicle (1000 bp). Right Lane 1: PLe-plasmid after EcoRI/XhoI cutting (5000 bp). Right Lane 2: PLe-MTS-hTERT-plasmid after EcoRI/XhoI cutting (5000 bp+4000 bp). Lane 3: PDOWN-MTS-hTERT-vehicle after EcoRI/XhoI cutting (4000 bp+1000 bp). (B) DNA sequencing of MTS-hTERT fusion gene. MTS (87 bp) was located in 50-136 bp (yellow). (C) Immunofluorescence staining shows that the co-localization (yellow) of mitochondrial hTERT (green) and mitochondria (red) in non-transfected and lentivirus-transduced HepG2 and SK-Hep1 cells. Nuclei were counterstained blue with DAPI. Magnification: 1200×. N: nuclear hTERT, C: cytoplasmic hTERT, I: intermediate hTERT. (D) Histogram represents the quantitative analysis of co-localization signals, comparing the average fluorescence intensity per unit area. *P<0.01. (E) Western blot shows expression of mitochondrial and nuclear hTERT: mitochondrial hTERT was normalized to GAPDH and nuclear hTERT was normalized to PCNA. (F) Histogram Histogram represents the quantitative analysis of gray ratio, *P<0.05. #P>0.05.
