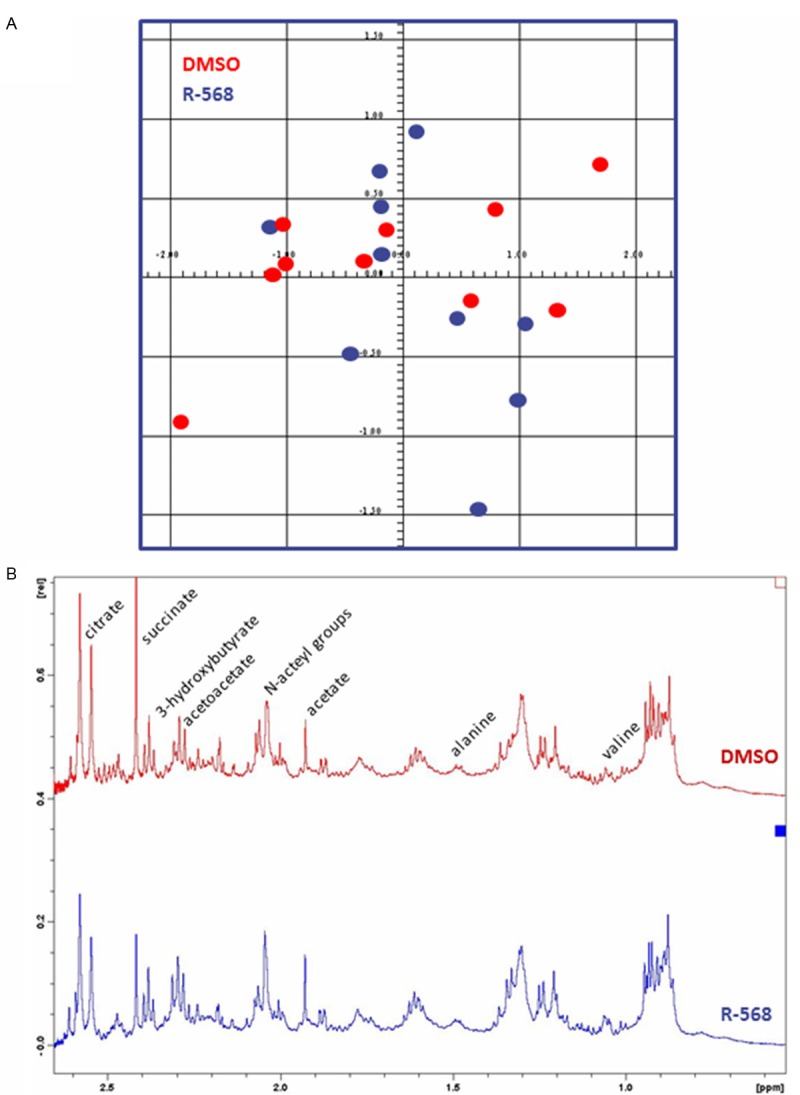
Figure 1.

1H nuclear magnetic resonance (1H-NMR) metabolomics analysis on urine samples from DMSO-treated and R-568-treated mice. A. Representative score plot of principal component analysis (PCA, AMIX software) of urinary metabolomes of DMSO-treated (red dots) and R-568-treated (blue dots) mice. No significant difference is observed between urine metabolite profiles of both groups. B. Representative 1H-NMR spectrum of urine metabolome of a DMSO-treated (upper panel) and an R-568-treated (lower panel) mice. The relative abundance of urinary acetoacetate, alanine, 3-hydroxybutyrate and valine, is similar in samples from either group.
