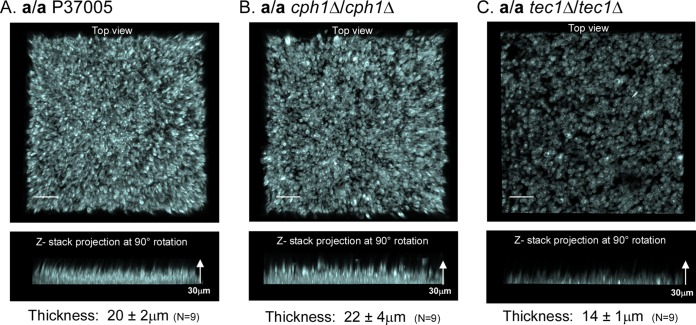
FIG 3.
The average thickness of the basal yeast cell polylayer formed by the a/a tec1Δ/tec1Δ mutant after 4 h was smaller than those of the a/a P37005 and a/a cph1Δ/cph1Δ biofilms. Preparations were stained with calcofluor white and scanned by LSCM. The upper image for each strain provides the top surface of the projection of LSCM x-y scans of a representative biofilm (z-interval = 0.25 μm). The lower image for each strain represents a side view of the same projection. (A) a/a P37005 (control). (B) a/a cph1Δ/cph1Δ mutant. (C) a/a tec1Δ/tec1Δ mutant. The mean thickness ± standard deviation for the yeast-phase cell polylayer of each strain is presented underneath the lower image of each panel. Measurements were for three regions of three independent biofilms, resulting in a total (n) of 9 measurements. Bars = 20 μm.

