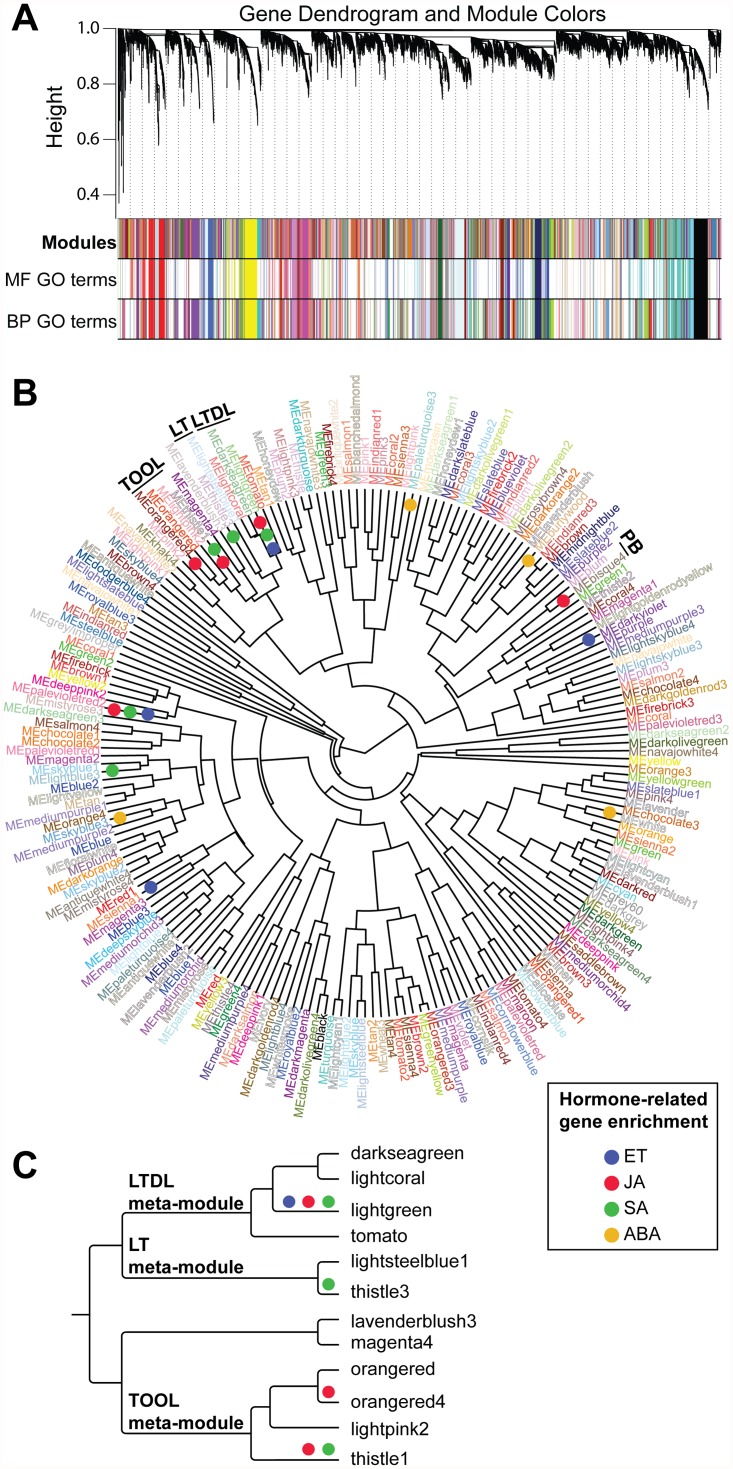
Fig 2. Graphical visualization of the Arabidopsis co-expression network.
(A) Dendrogram of all differentially expressed probesets clustered based on a dissimilarity measure (1—TOM). Each line of the dendrogram corresponds to a probeset. The first multi-color bar below the dendrogram shows the 205 modules identified using the dynamic cutting method with each gene color-coded based on module assignment. The second and third multi-color bars highlight the modules enriched (P-value < 0.01) in molecular function (MF) and biological process (BP) GO terms. Each line corresponds to genes in modules enriched in GO terms, while line colors identify module membership. Module gene members are not always adjacent to each other because WGCNA modules do not comprise only leaves with their direct ancestors. (B) Circular tree showing hierarchical clustering of the 205 module eigengenes. Modules that are enriched in genes associated with hormones (ET: ethylene, JA: jasmonic acid, SA: salicylic acid, and ABA: abscisic acid) and that are part of higher-order (meta) modules discussed in the text are highlighted. (C) Hierarchical cluster tree showing the relationship between the TOOL, LTDL, and LT meta-modules based on correlations between their respective eigengenes. Hormone enrichment is also depicted in the tree.

