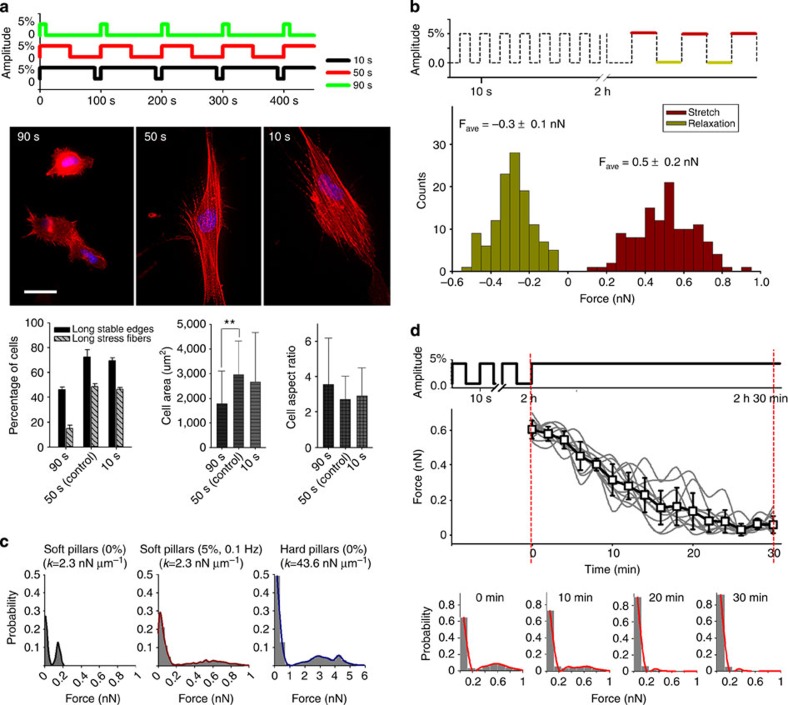
Figure 3. Effects of relaxation time of cyclic stretching on cell morphology and contractile responses of cells to cyclic stretch.
(a) PMEFs on soft pillars with 5% cyclic stretching (0.01 Hz) for 6 h at different relaxation times: 10 s (n=95 cells); 50 s (n=126 cells); 90 s (n=114 cells). Cells were fixed 6 h after seeding and stained with RP and DAPI. Scale bar=30 μm. Error bars; s.e.m. **P<0.01; Student’s t-test. (b) Distributions of forces calculated from single stretch–relaxation event. Cells were first stretched for 2 h (5%, 0.1 Hz) after seeding and then displacements of pillars were calculated from single stretch–relaxation event (n=12 cells). Only the pillars near the cell edge were calculated. Fave means average forces measured on stretch–relaxation. (c) Distributions of forces on soft or hard pillars (n>300 pillars). (d) Changes in forces over time on changing from 5% cyclic stretching after 2 h to 5% static stretching (n>300 pillars). Experiments were repeated at least three times and showed similar results.

