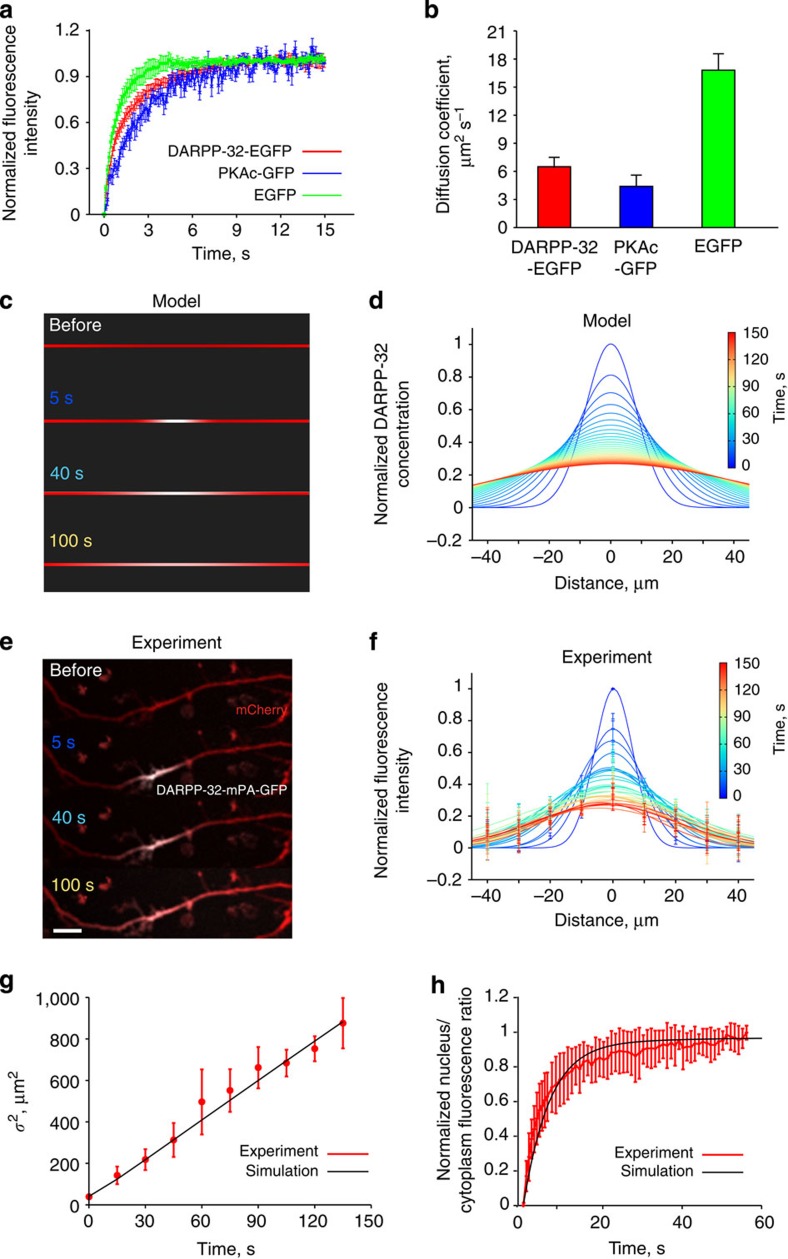
Figure 1. DARPP-32 moves along dendrites by passive diffusion.
(a) FRAP, normalized to the highest fluorescence intensity (mean±s.e.m., six replicates for DARPP-32-EGFP; five for PKA-GFP; six for EGFP). (b) Diffusion coefficients derived from the curves shown in a. (c) Spreading of DARPP-32 molecules (white), initiated at the centre of the dendrite of a modelled neuron. (d) Summary of DARPP-32 fluorescence spreading and decay in the neuron modelled in c. (e) Spreading of mPA-GFP-DARPP-32 after photo-activation of the tag fluorescence in dendrites of cultured MSNs. mPA-GFP fluorescence is in white, neuronal shape is revealed by co-transfected mCherry. Scale bar, 10 μm. (f) Summary of DARPP-32 fluorescence spreading and decay in cultured MSNs. Data are means±s.e.m. of the average intensity for every 10-μm region (n=7). In d,f each colour represents a time point, with 5-s intervals, for a total duration of 150 s. (g) Comparison between the variance (square of sigma, μm2) of Gaussian curve fitting based on each time point in experiments d (mean±s.e.m., n=7) and simulation result of modelled neuron (using a diffusion coefficient of 4 μm2 s−1). (h) Validation of the model parameters used for DARPP-32 nuclear translocation, by the comparison of the model simulation results (black line) with our experimental observations on nuclear translocation after photoactivating cytosolic mPA-GFP-DARPP-32 fluorescence (red line, means±s.e.m., n=6). R2=0.93.

