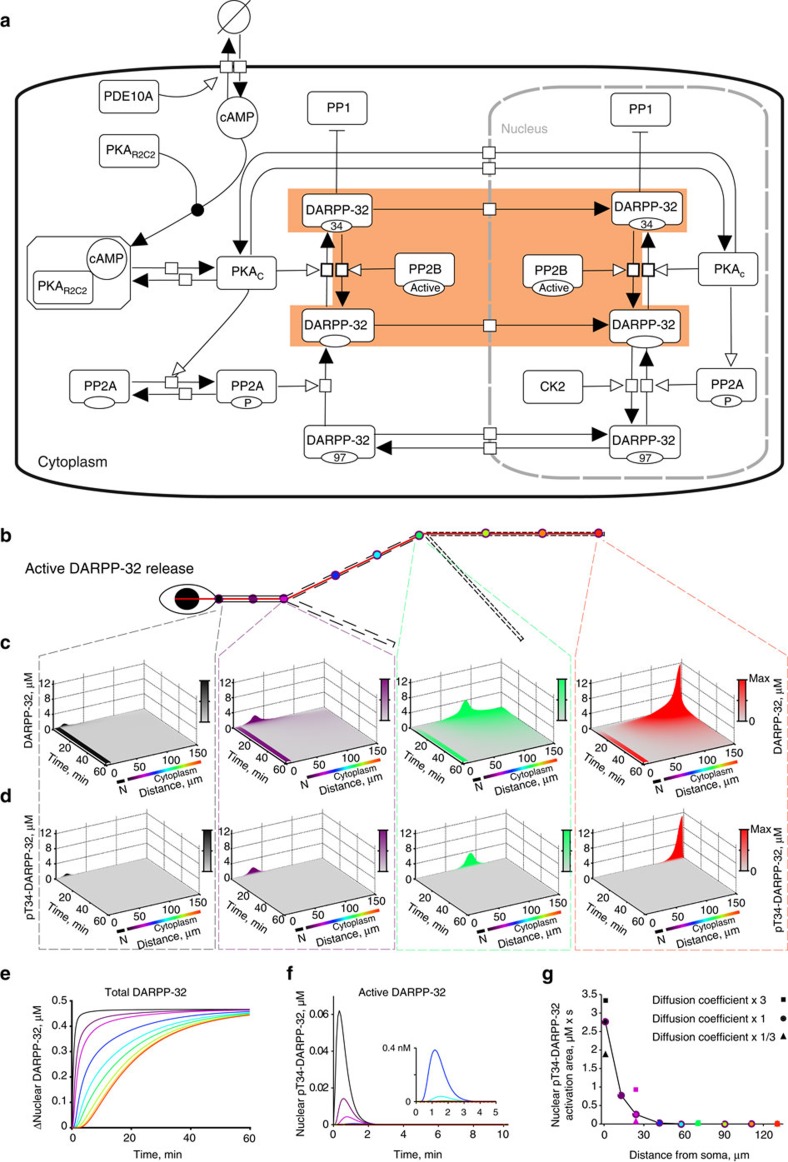
Figure 2. Phospho-DARPP-32 dendrites-to-nucleus reaction-diffusion model.
(a) Model diagram of the reactions included in the model, depicted in Process description language of the systems biology graphical notation69. The sub-model used for the spreading of dendritically activated DARPP-32 and its dephosphorylation by calcineurin (PP2B) is highlighted in orange. (b) Two-dimensional representation of the modelled neuron, with the positions of the nine stimulation locations (coloured circles). The red line indicates where the spatial and temporal map of DARPP-32 was measured. (c,d) Spatial and temporal changes in the total DARPP-32 (c) and pT34-DARPP-32 (d) concentration, after pT34-DARPP-32 molecules were released at the beginning of primary (black), end of primary (magenta), end of secondary (green) and end of tertiary dendrite (red) as indicated in b and by dashed lines. Colour intensities are proportional to the maximum concentration (Max) reached for each simulation. N, nucleus. (e) Time course of the total DARPP-32 average increase in concentration (Δ) inside the nucleus, after pT34-DARPP-32 release at nine distinct dendritic locations indicated in b. (f) Same as in e for pT34-DARPP-32. (g) Integration of DARPP-32 activation, corresponding to the areas under the curves in f, plotted as a function of distance between the stimuli and soma. Square and triangle represent results of calculation in which the diffusion coefficient of DARPP-32 was increased or decreased threefold (that is, changing diffusion coefficient from 7 to 21 or 2.3 μm2 s−1).

