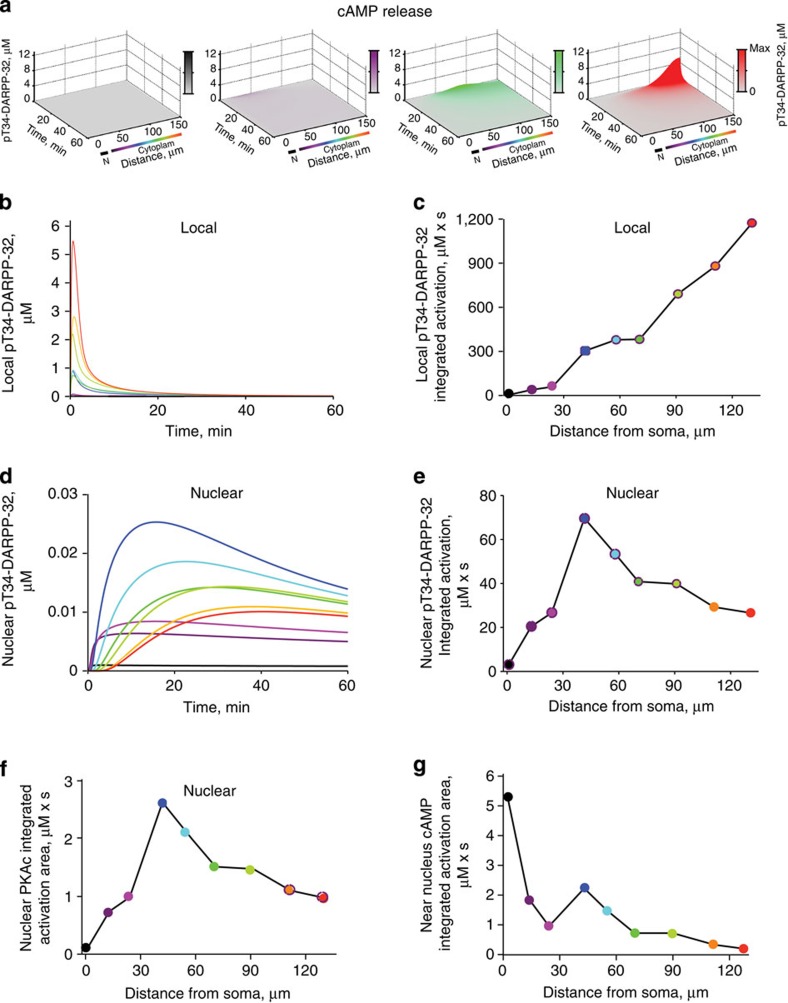
Figure 3. Model predicts nonlinear cAMP signalling from dendrites to nucleus.
(a) Spatiotemporal changes in pT34-DARPP-32 concentration along the line indicated in Fig. 2b, after cAMP molecules were released in 5 s at the beginning of primary (black), end of primary (magenta), end of secondary (green) or end of tertiary dendrite (red). Colour intensities are proportional to the maximum concentration (Max) reached for each simulation. N, nucleus. (b) Time course of pT34-DARPP-32 concentration at the location of cAMP release. (c) Plot of integration of local DARPP-32 activation (area under the curve in b) as a function of the distance between the stimuli and soma. (d) Time course of pT34-DARPP-32 concentration in the nucleus. (e) Plot of integration of nuclear DARPP-32 activation (area under the curve in d) as a function of the distance between the stimuli and soma. (f) Integrated nuclear PKA activity (area under the curves in Supplementary Fig. 4b), as a function of the distance from the dendritic site of cAMP release. (g) Integrated cAMP activity (area under the curves in Supplementary Fig. 4e), as a function of the distance from the cAMP release site.

