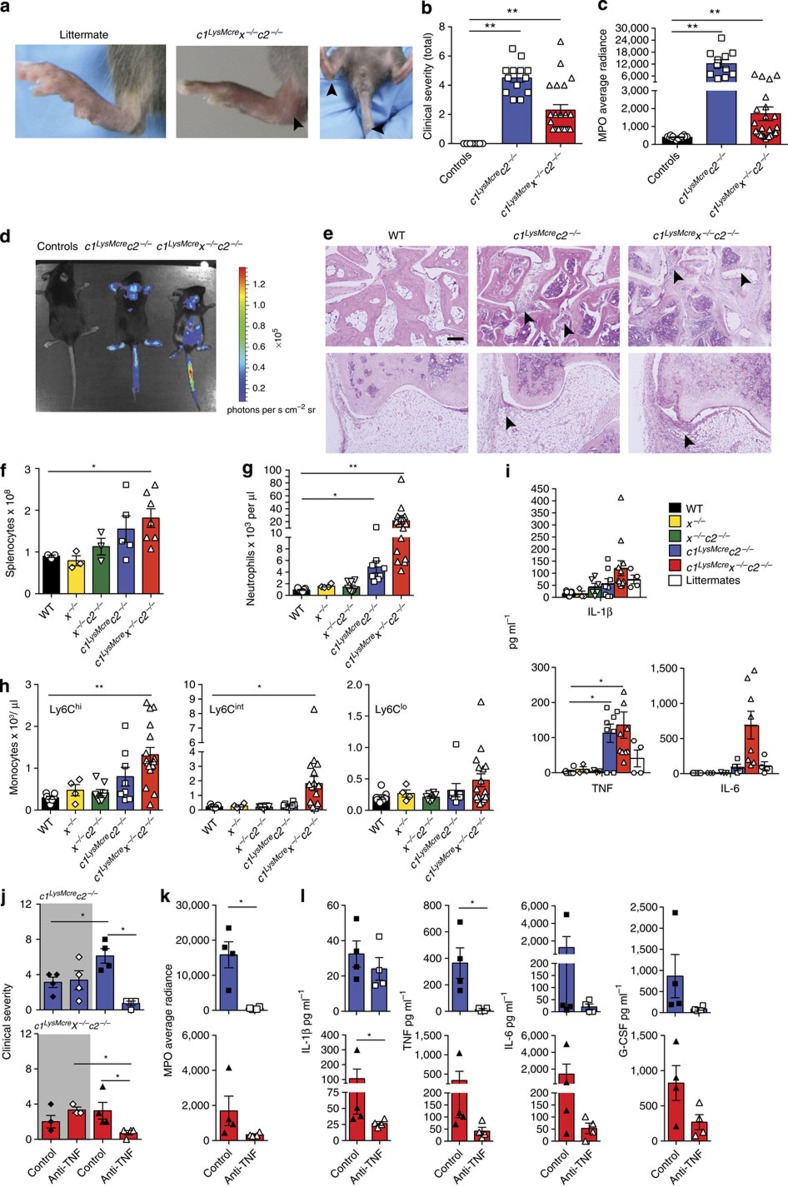
Figure 8. Loss of IAPs in myeloid cells drives TNF-dependent inflammatory joint disease.
(a–e) WT, littermate controls and c1LysMcrex−/−c2−/− and c1LysMcrec2−/− mice were monitored for spontaneous inflammatory disease. (a) Photos depicting examples of a normal ankle (littermate) and severe swelling in the ankle and tail of a c1LysMcrex−/−c2−/− mouse. (b) Clinical severity score of swelling and redness (0–3 for severity per limb). Data are the clinical score of individual mice (out of 12). Mean±s.e.m., **P<0.01, Mann–Whitney two-sample rank test. (c) Neutrophil activity assessed by myeloperoxidase (MPO) average radiance of four limbs per mouse, measured using an IVIS spectrum after bioluminescent luminol injection. Data are the mean of individual mice. Mean±s.e.m., **P<0.01, Mann–Whitney two-sample rank test. (d) Representative bioluminescent images of MPO activity in control and indicated mutant mice. (e) Representative histological examples of disease in WT control, and diseased c1LysMcrex−/−c2−/− and c1LysMcrec2−/− ankle (top) and knee (bottom) tissue. Magnification, × 10; scale bar, 100 μM. (f) WT and IAP mutant splenocyte counts. Symbols indicate individual mice and data are the mean±s.e.m. *P<0.05, Student’s two-tailed t-test. (g,h) WT and IAP mutant mice peripheral blood (g) neutrophil and (h) monocyte subset number were analyzed by flow cytometry. Symbols indicate individual mice. Mean±s.e.m., *P<0.05, **P<0.01, Student’s two-tailed t-test. (i) Levels of cytokines, IL-1β, TNF and IL-6 were measured in the serum of WT and IAP mutant mice by ELISA. Symbols indicate individual mice Data show the mean±s.e.m. *P<0.05, Student’s two-tailed t-test. (j–l) c1LysMcrex−/−c2−/− and c1LysMcrec2−/− mice were treated with anti-TNF monoclonal antibody (XT-22) or isotype control for 3 weeks, after which (j) clinical severity (grey shading indicates pre-treatment clinical scores) and (k) MPO activity in limbs and (l) serological cytokine levels were assessed. Symbols represent individual mice, mean±s.e.m. *P<0.05, Mann–Whitney two-sample rank test (j,k) or Student’s two-tailed t-test (l).

