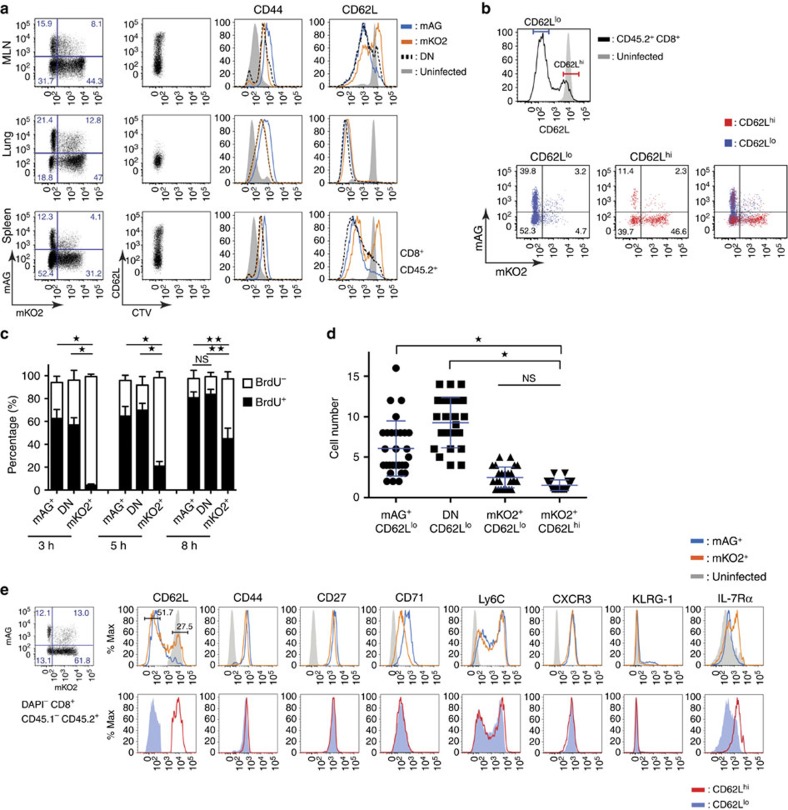
Figure 2. The mKO2-positive cells reappearing on day 7 p.i. are slower cycling cells.
Magnetic-activated cell sorting-purified Fucci/OT-I (CD45.2+) cells were labelled with CTV dye and transferred into CD45.1+ recipients prior to intranasal (i.n.) PR8-OVA influenza A virus infection. (a) Representative flow plots of mediastinal lymph nodes (MLNs), lungs and spleens on day 7 p.i. The histograms show CD44 and CD62L levels for mAG+ (blue), mKO2+ (orange) and DN (black dot) cells from infected mice against naive cells in uninfected mice (grey solid). Data are representative of three independent experiments with three to five mice each. (b) Backgating analysis for expression profiles of mAG versus mKO2 in CD62Lhi and lo subsets from the spleens of mice on day 7 p.i. CD62Lhi (red) and lo (blue) gates were determined as shown in the histogram and compared for mAG versus mKO2 in dot plots. Data are representative of three independent experiments with three to five mice each. (c) BrdU incorporation in virus-specific CD8+ T cells on day 7 p.i. The percentages of BrdU+ cells in mAG+, mKO2+ or DN subpopulations in spleens were assessed at 3, 5 and 8 h after BrdU intraperitoneal administration on day 7 p.i. Data are representative of three independent experiments with four mice each. Bars show mean with s.d. (n=12, *P<0.001, **P<0.01; two-way analysis of variance (ANOVA)). (d) mAG+CD62Llo, DN CD62Llo, mKO2+CD62Llo and mKO2+CD62Lhi subsets within the CD8+ CD45.2+ cell population were sorted on day 7 p.i. as single cells and cultured in rIL-2 (10 ng ml−1) containing medium. The wells with a single cell at the time 0 were observed by time-lapse imaging to count the cell number at 48 h. Data were summarized from three independent experiments. Bars show mean with s.d. (n=35, *P<0.001 versus KO+CD62Lhi; NS, not significant. ANOVA). (e) Memory-specific cell surface markers on virus-specific CD8+ T cells on day 7 p.i. Top panel: histograms of each marker are shown for mAG+ (blue line) versus mKO2+ (orange line) compared with naive cells in uninfected mice (grey solid). Bottom panel: histograms of each marker are shown for CD62Lhi (red line) versus CD62Llo (blue solid). Data are representative of three independent experiments with three mice each.

