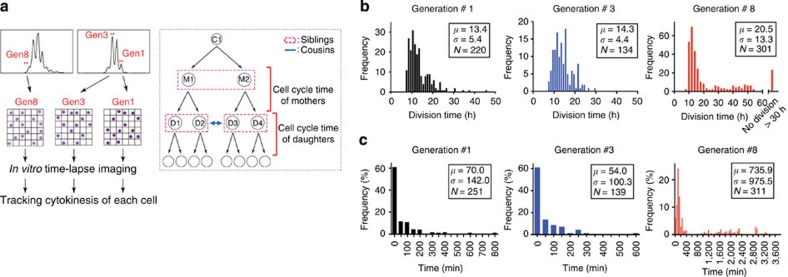
Figure 4. Real-time tracking of Fucci CD8+ T-cell divisions at the single-cell level.
(a) Left: scheme about tracking cytokinesis of individual cells. Magnetic-activated cell sorting-purified Fucci CD8+ T cells were labelled with CTV dye and stimulated with plate-bound anti-CD3ε (1.0 μg ml−1) and anti-CD28 mAb (0.5 μg ml−1). Cells in the 1st, 3rd and 8th generation were sorted and placed into microgrids. Time-lapse imaging was performed every 3–4 min for 66–90 h and sequential cytokinesis was traced to measure cell cycle time. Right: scheme of the family tree of tracked cells. First, single cells found as only one cell in microgrid wells were tracked for several divisions. Cells from the 1st division are designated ‘mothers (M1 and M2)’ and the cells from the 2nd divisions ‘daughters (D1, D2 or D3, D4)’. In addition, ‘daughter’ groups are distinguished as ‘siblings (D1 versus D2 or D3 versus D4)’ from the same mother or ‘cousins (D1/D2 versus D3/D4)’ from different mothers. (b) The distribution of measured cell cycle times are shown in each histogram. Each histogram represents sorted cells in the 1st (black), 3rd (blue) and 8th (red) generation. Data were summarized from three independent experiments. Mean (μ), s.d. (σ) and number of events (N) are shown. (c) The percentage of frequency for mKO2+ phase duration of cells from the 1st, 3rd and 8th generations is shown in the histograms. Each histogram represents sorted cells in the 1st (black), 3rd (blue) and 8th (red) generations. Data were summarized from three independent experiments. Mean (μ), s.d. (σ) and number of events (N) are shown.

