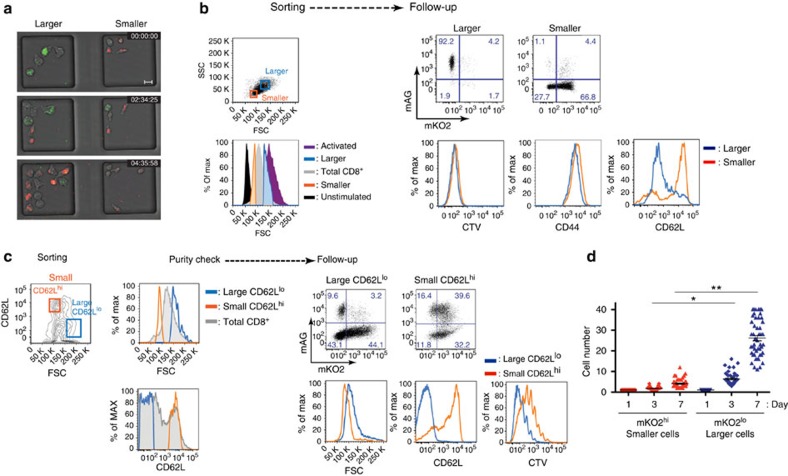
Figure 5. Cell size correlated with different CD62L expression levels and proliferative activity.
(a) Representative snapshots from a time-lapse movie of sorted 8th-generation cells between the 3rd and 4th imaging day. The left well with larger sized cells and the right well with smaller sized cells were imaged on the same microgrid array simultaneously under the same condition. The snapshots from a representative movie (Supplementary Movie 2) from three independent experiments are shown (scale bar, 10.0 μm). (b) Flow cytometric analysis of CD62L expression and cell size of in vitro stimulated CD8+ T cells (plate-bound anti-CD3ε (1.0 μg ml−1) and anti-CD28 mAb (0.5 μg ml−1)) on day 7. Left: sorting gate for smaller or larger sized cells. Right: plots of the mAG versus mKO2 levels in smaller and larger sized cells after 3 days of culture with 10 ng ml−1 of rIL-2. The histograms of each marker are shown for smaller sized cells (orange line) versus large cells (blue line). Data are representative of three independent experiments. (c) The larger CD62Llo and smaller CD62Lhi donor Fucci/OT-I cells sorted from splenocytes of PR8-OVA-infected mice on day 7 p.i. were cultured to compare proliferative activity. Left: sorting gate for larger CD62Llo (blue line) and smaller CD62Lhi (orange line) cells. Sorted samples were checked for purity. After labelling with CTV dye, cells were cultured with 10 ng ml−1 of rIL-2 for 3 days. Right top: dot plots depicting the level of mAG versus mKO2 expression between the larger CD62Llo cells and the smaller CD62Lhi cells after following culture. Right bottom: histograms of CD62L level and CTV dye dilution are shown for the larger CD62Llo (blue line) and smaller CD62Lhi (orange line) cells. Data are representative of three independent experiments with three mice each. (d) Cell numbers from sequential divisions of cells sorted based on cell size. The smaller sized mKO2hi and larger sized mKO2lo donor Fucci/OT-I cells from splenocytes of PR8-OVA-infected mice on day 7 p.i. were plated by single-cell sorting. The sorted cells were cultured in rIL-2 (10 ng ml−1) containing medium. Wells with a single cell at time 0 were followed up by imaging on days 1, 3 and 7, and the number of cells in each well was counted. *P<0.05, **P<0.001 by the Mann–Whitney’s U-test.

